Wednesday, September 30, 2009

Jordan to Desalinate Red Sea Water in Dead Sea


This report is none too clear, but the gist of the plan is to operate a desalination plant on the Red sea or even uphill near the Dead Sea. A byproduct of desalination happens to be concentrated brine usually equal to a third or so of the through put. In the gulf this brine is put back into the sea as conveniently as possible.


In this particular case we are pumping the sea water somewhat up hill to the Dead Sea and then running it all through a turbine to produce power sufficient to pay for the pumping and perhaps even all the energy cost of the desalination itself. If it can be made to work that efficiently, then it is a given that this is one of many such plants and that the Dead Sea will be slowly recharged.


The only limit then will be the ability of the Dead Sea to absorb brine, and since surface area expands as it fills, it is quite a lot larger than simple calculations would likely suggest.


We can certainly take it back to historical levels and even a great deal higher since it was once much fuller.


The natural high grade brines will sit under the layer of new brines and be pumped out as needed for industrial purposes. This is a small inconvenience.


Jordan to go solo with Red Sea to Dead Sea pipeline


http://www.terradaily.com/images/red-sea-dead-sea-pipeline-bg.jpg


The plan is for the pipeline to draw off 310 million cubic metres (10.5 billion cubic feet) of water each year, of which 240 million will be fed into the desalination plant at the Jordanian Red Sea port of Aqaba, enabling an annual production of 120 million cubic metres of drinking water.


by Staff Writers


Amman (AFP) Sept 27, 2009


http://www.terradaily.com/reports/Jordan_to_go_solo_with_Red_Sea_to_Dead_Sea_pipeline_999.html


Jordan has decided to go it alone and build a two-billion-dollar pipeline from the Red Sea to the Dead Sea without help from proposed partners Israel and the Palestinian Authority, an official told AFP.


"Jordan is thirsty and cannot wait any longer," said Fayez Batayneh, the country's chief representative in the mega-project to provide drinking water and begin refilling the Dead Sea, which is on course to dry out by 2050.


"Israel and the Palestinians have raised no objection to Jordan starting on the first phase by itself," Batayneh said.


"The first stage, at an estimated cost of two billion dollars, will begin in 2010 and should be completed in 2014 on a BOT (build, operate, transfer) basis," he said.


The plan is for the pipeline to draw off 310 million cubic metres (10.5 billion cubic feet) of water each year, of which 240 million will be fed into the desalination plant at the Jordanian Red Sea port of Aqaba, enabling an annual production of 120 million cubic metres of drinking water.


Batayneh said the remaining 190 million cubic metres will be channelled towards the Dead Sea, the saltiest natural lake on the planet and the lowest point on the earth's surface.


Jordan, where the population of six million people is expanding by 3.5 percent a year, is recognised as one of the 10 driest countries in the world, with desert covering 92 percent of its territory.


The kingdom relies mainly on winter rain for its water needs, which are projected to reach 1.6 billion cubic metres in 2015.


Israel, the Palestinian Authority and Jordan agreed in 2005 on the outlines of a project to channel two billion cubic metres of water a year via a 200-hilometre (120-mile) canal in order to restore the level of the Dead Sea, produce fresh water and generate electricity.


The total cost of the scheme has been estimated at 11 billion dollars.


Hockey Stick Fraud


There is no way to be generous or to dodge this bullet. We now have outright confirmation that the data was deliberately selected to provide the dramatic eye catching result that was made it so famous. This is not science so much as a publicist’s dodgy manipulation of data to support a doubtful scheme.


I am certain every scientist has faced the frustration of months of hard work merely showing no evidence for the proposed theory. Once again our scientists had no evidence. So they merely selected the best data points in a statistical distribution and discarded the rest. I can prove anything if I am allowed to do that. Hell, I know of this great gold mine in which the grades exceed five ounces to the ton. – see this assay sheet?


When these guys floated their paper, they had no expectation anyone else would care and result were important in order to push their spurious claims. Then the world paid attention and they hid the data for ten years so no one could discover what they had done.


That is now over and we now left with a paper that manipulated the data in several places and actually fabricated the hockey stick upswing. It does not get any worse than this and on top of that it has been poisoning the debate for a decade instead of been called to account immediately.


In fact, why did the referees not ask for the raw data they relied on? That chart was simply too good to be true and everyone was lazy. I know that I thought it suspect the first time I laid eyes on it. But then after years of reviewing assay results, I am a little more demanding perhaps and appreciative how difficult it is to get good data at all.


Monday, September 28, 2009


http://planetgore.nationalreview.com/post/?q=Y2Q5ZGExZTc3ZTlmMTA5OTdhOGRjNzdlNmU4N2M4ZTg


Mann-made Warming Confirmed [Chris Horner]


It turns out that trees can scream.


A colleague in the climate-realist blogosphere sends along the following narrative which all Planet Gore readers, even the muttering monitors over at Team Soros, should find very interesting. The inescapable and powerful conclusion is that Mann-made warming is real, while man-made warming remains at best a theory, more likely a hypothesis. Really.


This story deserves to be told.


1: In 1998, a paper is published by Dr. Michael Mann, then at the University of Virginia, now a Penn State climatologist, and co-authors Bradley and Hughes. The paper is named: Northern Hemisphere Temperatures During the Past Millennium: Inferences, Uncertainties, and Limitations. The paper becomes known as MBH98.


The conclusion of tree ring reconstruction of climate for the past 1,000 years is that we are now in the hottest period in modern history, ever.


See the graph http://www.ncdc.noaa.gov/paleo/image/mann/manna_99.gif


Steve McIntyre, a Canadian mathematician in Toronto, suspects tree rings aren't telling a valid story with that giant uptick at the right side of the graph, implicating the 20th century as the "hottest period in 1000 years," which alarmists latch onto as proof of AGW. The graph is dubbed the "Hockey Stick" and becomes famous worldwide. Al Gore uses it in his movie An Inconvenient Truth in the famous "elevator scene."


2: Steve attempts to replicate Michael Mann's tree ring work in the paper MBH98, but is stymied by lack of data archiving. He sends dozens of letters over the years trying to get access to data but access is denied. McIntyre and Ross McKitrick, of the University of Guelph publish a paper in 2004 criticizing the work. A new website is formed in 2004 called Real Climate, by the people who put together the tree ring data and they denounce the scientific criticism:


http://www.realclimate.org/index.php/archives/2004/12/false-claims-by-mcintyre-and-mckitrick-regarding-the-mann-et-al-1998reconstruction/

3: Years go by.McIntyre is still stymied trying to get access to the original source data so that he can replicate the Mann 1998 conclusion. In 2008 Mann publishes another paper in bolstering his tree ring claim due to all of the controversy surrounding it. A Mann co-author and source of tree ring data (Professor Keith Briffa of the Hadley UK Climate Research Unit) used one of the tree ring data series (Yamal in Russia) in a paper published in the Philosophical Transactions of the Royal Society in 2008, which has a strict data archiving policy. Thanks to that policy, Steve McIntyre fought and won access to that data just last week.


4: Having the Yamal data in complete form, McIntyre replicates it, and discovers that one of Mann's co-authors, Briffa, had cherry picked 10 tree data sets out of a much larger set of trees sampled in Yamal.


5: When all of the tree ring data from Yamal is plotted, the famous hockey stick disappears. Not only does it disappear, but goes negative. The conclusion is inescapable. The tree ring data was hand-picked to get the desired result.


These are the relevant graphs from McIntyre showing what the newly available data demonstrates.


http://www.climateaudit.org/wp-content/uploads/2009/09/rcs_chronologies1.gif

http://www.climateaudit.org/wp-content/uploads/2009/09/rcs_merged.gif


So now the question is, if tree rings scream and their message is one that few want to hear, does their message get heard?


Cancer Biossenser Development


This is a pleasant surprise that leaps us forward to the day when cancer is cured. It is well known that early detection allows us to aggressively eliminate the disease while it is still easy to treat.


I recall that in the first applications of the AIDS cocktail that the dosages were aggressive and caused severe side effects. Today the process is almost gentle and victims are living out their lives in very good order.


We have the ability to do this with the early onset stages of almost all cancers, yet the care is dominated by late cancers and desperate interventions. So a device able to screen immediately for the presence of offending cell forms will swiftly change all that.


And intervention is likely to be a cocktail of specific drugs able to suppress the problem, or location and removal if warranted.


It also sounds like it will be available rather quickly and can become as ubiquous as a stethoscope.


This also technology that will see steady upgrading similar to what we have experienced with cell phones.


September 28, 2009


U of T researchers create microchip that can detect type and severity of cancer


http://nextbigfuture.com/2009/09/u-of-t-researchers-create-microchip.html


https://blogger.googleusercontent.com/img/b/R29vZ2xl/AVvXsEjGOwunHfYHhogeBQK5G56e6trYciMdwmig4oaa8IYIu2PlrZZE0ztIxQm1qY-9_qYNJcbGWEj_v_mLXuVb-oOTC_EPzJRTxYbf8jjKSXgNnmk8GNq1clz19kCRSaGpS_nE_Vss4lY5qOc/s1600-h/cancerdiagcanada.jpg


University of Toronto researchers, Shana Kelley and Ted Sargent, have made a cancer diagnostic breakthrough. Kelley said a five-year time frame would be a "conservative estimate" to get the device on the market.


U of T researchers have used nanomaterials to develop an inexpensive microchip sensitive enough to quickly determine the type and severity of a patient's cancer so that the disease can be detected earlier for more effective treatment.


The researchers' new device can easily sense the signature biomarkers that indicate the presence of cancer at the cellular level, even though these biomolecules - genes that indicate aggressive or benign forms of the disease and differentiate subtypes of the cancer - are generally present only at low levels in biological samples. Analysis can be completed in 30 minutes, a vast improvement over the existing diagnostic procedures that generally take days.


"Today, it takes a room filled with computers to evaluate a clinically relevant sample of cancer biomarkers and the results aren't quickly available," said Shana Kelley, a professor in the Leslie Dan Faculty of Pharmacy and the Faculty of Medicine, who was a lead investigator on the project and a co-author on the publication.


"Our team was able to measure biomolecules on an electronic chip the size of your fingertip and analyse the sample within half an hour. The instrumentation required for this analysis can be contained within a unit the size of a BlackBerry."

Kelley, along with engineering professor Ted Sargent - a fellow lead investigator and U of T's Canada Research Chair in Nanotechnology - and an interdisciplinary team from Princess Margaret Hospital and Queen's University, found that conventional, flat metal electrical sensors were inadequate to sense cancer’s particular biomarkers. Instead, they designed and fabricated a chip and decorated it with nanometre-sized wires and molecular "bait."


Abstract Nature Nanotechnology: Programming the detection limits of biosensors through controlled nanostructuring


Advances in materials chemistry offer a range of nanostructured shapes and textures for building new biosensors. Previous reports have implied that controlling the properties of sensor substrates can improve detection sensitivities, but the evidence remains indirect. Here we show that by nanostructuring the sensing electrodes, it is possible to create nucleic acid sensors that have a broad range of sensitivities and that are capable of rapid analysis. Only highly branched electrodes with fine structuring attained attomolar sensitivity. Nucleic acid probes immobilized on finely nanostructured electrodes appear more accessible and therefore complex more rapidly with target molecules in solution. By forming arrays of microelectrodes with different degrees of nanostructuring, we expanded the dynamic range of a sensor system from two to six orders of magnitude. The demonstration of an intimate link between nanoscale sensor structure and biodetection sensitivity will aid the development of high performance diagnostic tools for biology and medicine.


2 page pdf with supplemental information


Shana Kelly Lab webpage at the University of Toronto


"Uniting DNA - the molecule of life - with speedy, miniaturized electronic chips is an example of cross-disciplinary convergence," said Sargent. "By working with outstanding researchers in nanomaterials, pharmaceutical sciences, and electrical engineering, we were able to demonstrate that controlled integration of nanomaterials provides a major advantage in disease detection and analysis."


The speed and accuracy provided by their device is welcome news to cancer researchers.


The team's microchip platform has been tested on prostate cancer, as described in a paper published in ACS Nano, and head and neck cancer models. It could potentially be used to diagnose and assess other cancers, as well as infectious diseases such as HIV, MRSA and H1N1 flu.


"The system developed by the Kelley/Sargent team is a revolutionary technology that could allow us to track biomarkers that might have significant relevance to cancer, with a combination of speed, sensitivity, and accuracy not available with any current technology," said Dr. Fei-Fei Liu, a radiation oncologist at Princess Margaret Hospital and Head of Applied Molecular Oncology Division, Ontario Cancer Institute. "This type of approach could have a profound impact on the future management for our cancer patients."

Tuesday, September 29, 2009

Bronze Age Climate Restoration


Those who followed my blog last year saw me work at tracking and isolating the various likely factors responsible for the temperature variation experienced throughout the ten thousand year Holocene. A big question mark was the existence of a two thousand year or more Bronze Age optimum that ended with the Hekla event in 1159BCE. We ran down a lot of factors and in fairness none appeared up to the task of explaining that particular optimum.


Since then, the climate has precipitously cooled and then warmed slowly over decades approaching the former optimum but actually coming nowhere close. The Rhine has been frozen several times throughout history and each time local climate took a long time to recover.


Yesterday’s item finally provides a creditable mechanism to operate this engine.


We have a layer of freshened water that is between one to two hundred meters thick lying on top of the underlying ocean waters. The temperature of these underlying waters is about two degrees over the freezing point of fresh water ice. That is a huge supply of available heat that if actually mixed with the overlying ice would eliminate it.


The upper layer is a degree or so below the freezing point. This means that a sustained warm spell and plenty of help from winds could remove this layer. If this layer is removed, it becomes decidedly harder for sea ice to form at all and its breakup the next summer will simply put it back to the way it was.


With surface temperatures a couple of degrees above freezing during the summer, the land will warm up and as happened during the Bronze Age, the permafrost will disappear.


It is pretty obvious that the Hekla event gave twenty years without crops and that means the gain of at least a couple of meters of sea ice each of those years. Over twenty years that likely added up to a beginning round of forty meters. The process likely continued at a slower pace for centuries longer until the sea ice approached a thickness of even a hundred meters or more.


What happens with sea ice is that as it ages the salt is slowly removed and this salt mixes into the surrounding ocean were normal circulation takes it eventually out into the Atlantic.


Thus the post Bronze Age cold spell produced a fresh water layer sitting directly on top of the polar sea. The lack of severe storms failed to produce any mixing since it was way too thick anyway.


The present situation and some fortuitous winds appear to have thinned this layer and have led to the present gross reduction in sea ice thickness. I do not think that the remaining sea ice is any more than part of a two year cycle of ice passing through the gyre and if not that yet, is about to be.


The big question now is whether the winds or normal seasonal warming, sufficient to remove this fresh water cap anytime soon. We are at the point in which it can do a lot of good. Yet I am aware we have been here before for decades even only to have it abruptly end.


And that mechanism is now a little clearer. For some reason we get a summer or two without any melting and suddenly we have a lot of ice. One Alaskan Volcano could do that. It really is that quick. If this mass of left over freshened water from Hekla could be eliminated though, we could return to Bronze Age conditions.

G20 to Phase out fossil Fuel Subsidies


This is one step that I can agree with and that every country can enable as a common action. If all are doing this, there is no lobby argument that stands at all.


Now if we could now do the same thing with agricultural subsidies world wide making it a condition for maintaining the right to trade a given commodity. The subsidy game has been a way to play beggar my neighbor and has merely led to mutual damage unless you think free trade in agricultural goods between Europe and north America is unsustainable.


In fact the developed countries have all subsidized their agriculture to a huge degree an a competition to the bottom. This has meant that we have a form of consumer subsidy going on that is distortive. It has made it difficult for everyone else to break into our markets.


The good news is that developing countries are getting wise to the game and are starting to create working offsets to move their product and their own subsidies of course. In time, it will all sort itself out.


In the meantime, China and India have robust agricultural sectors whose expansion in output is easily keeping up with demand. A famine threatens in India and it is easy to divert global reserves to the Indian market.


Anyway, the simple application of a price guarantee for wind power and geothermal power will swiftly see the carbon based industry replaced though simple replacement as plants cycle to the end of their lives. Even early windmills are now been replaced with better gear.


As I have posted, we are going to see the oil supply drop from 85 million barrels per day to a stable 50 million barrels per day or less over the next decade or so. That is why the explorers are finally tackling the likes of politically volatile West Africa and just about any place with a hope in an attempt to sustain present levels. The shoe really has not dropped yet but it will take very little to expose our vulnerability and force the globe into oil rationing.


G20 leaders agree to phase out fossil fuel subsidies


by Staff Writers


Pittsburgh, Pennsylvania (AFP) Sept 23, 2009


http://www.energy-daily.com/reports/G20_leaders_agree_to_phase_out_fossil_fuel_subsidies_999.html


Leaders of emerging and developed nations agreed Friday to a US plan to phase out government subsidies for fossil fuel blamed for global warming, a joint statement said.


"We commit to rationalize and phase out over the medium term inefficient fossil fuel subsidies that encourage wasteful consumption," the leaders said after a two-day Group of 20 summit in Pittsburgh.


The leaders asked their energy and finance ministers to "develop implementation strategies and time frames" for the phasing out of the subsidies.


"We call on all nations to adopt policies that will phase out such subsidies worldwide," the statement said.


The leaders however underlined "the importance of providing those in need with essential energy services, including through the use of targeted cash transfers and other appropriate mechanisms."


The US plan was part of efforts to combat climate change, enhance energy security, improve public health and the environment, promote faster economic growth and support more effective targeting of government resources for the poor, officials said.


Key G20 nations China, India, Russia and Brazil reportedly are among the top spenders of fossil fuel subsidies and are unlikely to easily agree to any plans to slash them.


New Wind Industry Report by Pike


This report is out from Pikes Research but is pricy for the non industry reader. In the event, the summary gives us the important information that growth was fifty per cent over the past year. This year has seen barely a pause. In fact, from my own informants I know that projects were briefly put on hold and then went straight ahead.


As posted earlier, wind is on a tear. Industrial America wants their share and the lending industry wants the product because it is as good as it gets from a lender’s perspective. After all the fuel is free and the hardware is practically bullet proof and can operate for decades past the last payment. The only variable expense is how much to pay the accountants.


It will grow strongly this year and next year and likely straight through 2015.


I would also say that public acceptance is at an all time high. Builders seem to be staying away from any urban development and the attendant noise issues, and farmers who are stakeholders are obviously quiet, just like the oil business. Besides they look better than all those bill boards on the interstates.


Now we need to see the same building boom get rolling on geothermal in Nevada and our energy needs will be well on the way to been fully solved with fuel free systems.


Whatever government may think it is doing, it is clear that the American business community has decided to displace the oil industry and the coal industry just as fast as possible, even if it is possible to squeeze decades more out of the business.


Just remember, replacing oil, gas, and coal is an incredibly profitable business proposition. The only thing likely to compare to it in industrial history would have to be the Second World War. And it is completely financed through the most conventional lending sources. All government needs to do is largely stay out of the way.


Wind Energy Outlook for North America


Wind Power Generation Capacity and Turbine Deployments: Market Analysis and Forecasts


In 2008, United States wind power generation capacity passed the 25 gigawatt mark by adding over 8 gigawatts from the year before, which represented the largest individual gain of any country in the world. This growth rate of 50% exceeded that of the year before, indicating that the market is still relatively young and has room to grow, despite the economic slowdown. The market for wind turbines will continue to grow through 2015 driven by new generation additions as well as replacements of smaller, older turbines with new, larger, more efficient turbines. In 2007, generation capacity from renewable sources made up only 4% of the world’s electricity sources, but 16% of new electricity generation capacity additions were from renewables with wind power making up more than 80% of these gains by renewables.


The year 2009 will be a defining moment for wind power markets around the world. The global economic crisis that began in late 2008 has thrown the industry into confusion, along with most other global industries. Two competing market views exist, and representatives from each camp were interviewed for this report across the wind power value chain, such as components suppliers, turbine OEMs, wind developers, and power providers.


Table of Contents


1. Executive Summary


2. Market Issues


3. Technology Issues


4. Market Forecasts and Demand Drivers


5. Key Industry Players


View full Table of Contents


List of Charts and Figures


· Cumulative Installed Wind Capacity, North America: 2006-2015


· New Additions of Wind Capacity, North America: 2007-2015


· Growth in Cumulative Installed Wind Capacity, North America: 2007-2015


· Wind Energy Production, North America: 2006-2015


· Average Wind Turbine Price per Kilowatt, North America: 2007-2015


· New Wind Turbines Deployed, North America: 2007-2015


· Total Wind Turbines Deployed, North America: 2007-2015


· Wind Turbine Investments, North America: 2007-2015


· Wind Turbine Market Share by Manufacturer, World Markets: 2008


View full List of Charts and Figures

Monday, September 28, 2009

Arctic Salinity Impact Key


This came as a surprise. For the past two years, I had reasonably assumed that the erosion of the arctic ice pack reflected heat input from the atmosphere and was perplexed at the complete lack of related climate behavior even just south of the arctic.


Here it is argued that we are dealing with a reordering of the surface salinity and that this was triggered by a change in the wind system. In short, instead of a major application of atmospheric heat we are having a minor application of winds whose direct effect is vastly in excess of the input energy in terms of output energetics.


This also introduces another prime cooling mechanism in the form of an overturn of salinity that is also able to explain the sudden onset of so called little ice age conditions.


There have been many warm periods in the northern climate. These all appear to have ended abruptly. I have entertained several other mechanisms to attempt to understand this phenomenon. Understand that it is the precipitous decline that gives us difficulties rather than the gentle warming trend.


I am not sure how sound this argument happens to be or how well supported by data. That this is the first I have heard of it surprises because that is evidence of a lack of general distribution or discussion. I need to see more related discussion. However it is a compelling argument and draws us into a much better explanation for the abrupt onset of cold weather in the North.


There had to be some reason that the Rhine froze and allowed the Western Roman Empire to be overrun. It certainly cannot happen under our present understanding.


Thursday, September 24, 2009


CO2 is not melting the Arctic.


http://themigrantmind.blogspot.com/2009/09/co2-is-not-melting-arctic.html


It is modern myth that CO2 is melting the Arctic sea ice. No doubt many people will take immediate offence at the mere title of this post but they would do well to listen to the data before they jump. CO2 is supposed to heat the earth's atmosphere and then would melt the ice from above. The atmosphere can't get past the ice to warm the water below so the only logical conclusion is that a warm atmosphere should melt the ice from above.


But what is happening is the Arctic ice is melting from below due to warm waters that normally are about 100-200 m below the surface. I am going to show that due to a change in the winds, the Arctic ocean became more salty (salinization). The increase in salinity caused the underlying deeper waters to come into contact with the ice above, which melts the Arctic ice from below. Unless one can demonstrate that the wind change is due to global warming, one can't claim that CO2 is melting the Arctic ice.


Let's start by looking at the vertical temperature profile of the Arctic ocean. The surface layer, the layer in which the ice floats, is in general is fresher than the warm Atlantic sea water below.


https://blogger.googleusercontent.com/img/b/R29vZ2xl/AVvXsEiOK9uFhm8TMdu5yK-L6j-kyD9ID28Z50Lt-QqsuEsBe3o7HaXxaCkcRrwfM77X2592ATvhIiyFzkEQjSxhsm-48MvzVXB1_Ylma15i-BvbMKmyqZ9ao0USQUMQGaJ7usuui5p-M3mkFHoV/s1600-h/weatherArcticTempprofile.jpg


Note that about 200 meters beneath the sea surface, the water temperature is 2 deg C--well above the melting point. If that heat can get up to the surficial layer, past the fresh water, it would melt the ice. Since fresh water is less dense than salt water, the density difference is what keeps the warm water from the ice.


Now, the halocline, the layer of fresh water is about 50-100 meters thick. The ice above is only about 3 meters thick--people think the Arctic sea ice is hundreds of feet thick but it isn't (http://www.arctic.noaa.gov/essay.wadhams.html). What happened in the Arctic is that the halocline, the freshwater layer has been destroyed, or significantly reduced, and that has allowed heat from below to rise beneath the ice, melting it.


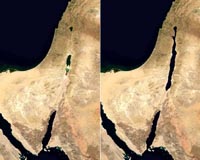
Here is how this happened. Below is a comparison of the wind patterns in the 70s and 80s vs, the late 80s and 90s.


https://blogger.googleusercontent.com/img/b/R29vZ2xl/AVvXsEirhPvvmSeWcsl9f8B4D1S0wc2V8iQVffDJvPJYLY3i1SFqHNBLo_BmjyqFvd4JU8OTqYK0BJaTjFcfyIfFcLj5b5uw-WxiahA3Qn1e3j6XDnnGk8HLzLVrEVT9YckQppAhEX3C_X3NwXZe/s1600-h/weatherArcticWinds.jpg


The left picture is 1979-1988; the right is 1989-1997. The big high pressure cell (red) present in the earlier times is gone in the later times. And that has had a big impact on the freshwater flow in the surficial waters of the Arctic ocean.


"This study was motivated by observations of significant salinification of the upper Eurasian Basin that began around 1989. Observational data and modelling results provide evidence that increased arctic atmospheric cyclonicity in the 1990s resulted in a dramatic increase in the salinity in the Laptev Sea and Eurasian Basin. Two mechanisms account for the Laptev Sea salinization: eastward diversion of Russian rivers, and increased brine formation due to enhanced ice production in numerous leads in the Laptev Sea ice cover. These two mechanisms are approximately the same intensity and are linked to changes in wind patterns. The resulting Laptev Sea salinity anomaly was then advected to the central Eurasian Basin. The strong salinization over the Eurasian Basin altered the formation of cold halocline waters, weakened vertical stratification, and released heat from the cold halocline layer upward. Our analysis suggests that local processes in the Laptev Sea may have a dramatic basin-wide impact on the thermohaline structure and circulation of the Arctic Ocean." Johnson, M. A., and I. V. Polyakov, The Laptev Sea as a source for recent Arctic Ocean salinity changes, Geophys. Res. Lett., 28, 2017-2020, 2001


The impact of that increased salinization is that the ice is no longer protected from the warmer waters below. Johnson and Polyakov state:


"The replacement of fresh surface waters with more saline waters reduced vertical stratification and increased heat flux, releasing heat from cold halocline layer to upper layers of the Eurasian Basin. The corresponding heat flux increase for the 1989-1997 period is as much as 3 W/ m-2 (Figure 4B) in this region, comparable to the change in heat flux over the Lomonosov Ridge and Amundsen Basin computed from SCICEX'95 data and a 1-D mixing model [Steele and Boyd, 1998]." Johnson, M. A., and I. V. Polyakov, The Laptev Sea as a source for recent Arctic Ocean salinity changes, Geophys. Res. Lett., 28, 2017-2020, 2001


Swift et al, say the same thing--that the heat from below is warming the ice above, melting it.


"The halocline is the principal density structure of the Arctic Ocean, separating the cold surface mixed layer from the warm Atlantic layer that lies below about 200 m. The climatic importance of the halocline is well recognized [e.g., Aagaard et al., 1981]. Some observations have suggested that regionally the halocline has thinned dramatically during the past 10-15 years, possibly sufficiently to increase the upward heat flux to the sea surface and its ice cover [Steele and Boyd, 1998]. Other recent work has linked large and rapid changes in the properties of halocline waters to shelf processes, including the melting of sea ice on the Barents shelf [Woodgate et al., 2001] and increased freezing in the Laptev Sea [Johnson and Polyakov, 2001]. There is in any event ample justification to seek evidence of earlier halocline changes similar to those during the 1990s." Swift, J. H., K. Aagaard, L. Timokhov, and E. G. Nikiforov (2005), Long-term variability of Arctic Ocean waters: Evidence from a reanalysis of the EWG data set, J. Geophys. Res., 110, C03012 ftp://odf.ucsd.edu/pub/jswift/2004JC002312.pdf p.8,9

Swift et al looked at records of temperature over the past 50 years looking for previous warming periods. They show a very interesting plot which shows the temperature structure of the Arctic Ocean over time. This picture is from the Nansen Basin.


https://blogger.googleusercontent.com/img/b/R29vZ2xl/AVvXsEhTMgTZVo4cXZFpTDO9AhJmAO8bx2y27s6Kwwlmoa5U-1U4rA7o0rGZJtzsmErck1Hw5B00QPPxbPwtyFca7rpJc91K2C5cRwhhiAZYMTTmDe_UV0REqBaq98OkjKRWpmPMbBWoYAK1P3U-/s1600-h/weatherArctictempprofhistory.jpg


You can see that there were warm periods in the underlying water three times during the past, the early 1950s, the mid 1960s and the early 1970s.


What is happening in the Arctic is not unprecedented. Shoot, 5000 years ago, all the permafrost around the arctic was melted.


" We find that beginning about 1976, most of the upper Arctic Ocean became significantly saltier, possibly related to thinning of the arctic ice cover. There are also indications that a more local upper ocean salinity increase in the Eurasian Basin about 1989 may not have originated on the shelf, as had been suggested earlier. In addition to the now well-established warming of the Atlantic layer during the early 1990s, there was a similar cyclonically propagating warm event during the 1950s. More remarkable, however, was a pervasive Atlantic layer warming throughout most of the Arctic Ocean from 1964–1969, possibly related to reduced vertical heat loss associated with increased upper ocean stratification. A cold period prevailed during most of the 1970s and 1980s, with several very cold events appearing to originate near the Kara and Laptev shelves. Finally, we find that the silicate maximum in the central Arctic Ocean halocline eroded abruptly in the mid-1980s, demonstrating that the redistribution of Pacific waters and the warming of the Atlantic layer reported from other observations during the 1990s were distinct events separated in time by perhaps 5 years. We have made the entire data set publicly available." Swift, J. H., K. Aagaard, L. Timokhov, and E. G. Nikiforov (2005), Long-term variability of Arctic Ocean waters: Evidence from a reanalysis of the EWG data set, J. Geophys. Res., 110, C03012


Now as long ago as 1998 it has been known that the warm waters beneath the ice was in direct contact with the ice, yet the global warming hysteriacs continue to ignore the scientific data

" Changes are also seen in other halocline types and in the Atlantic Water layer heat content and depth. Since the cold halocline layer insulates the surface layer (and thus the overlying sea ice) from the heat contained in the Atlantic Water layer, this should have profound effects on the surface energy and mass balance of sea ice in this region. Using a simple mixing model, we calculate maximum ice-ocean heat fluxes of 1–3 W m−2 in the Eurasian Basin, where during SCICEX'95 the surface layer lay in direct contact with the underlying Atlantic Water layer." Steele, M., and T. Boyd (1998), Retreat of the cold halocline layer in the Arctic Ocean, J. Geophys. Res., 103(C5), 10,419–10,435

Remember that the warm underlying Atlantic water is in direct contact with the ice above and that this is due to the salinization of the Arctic water. Here is the history of the salinization of the Arctic.


https://blogger.googleusercontent.com/img/b/R29vZ2xl/AVvXsEiVCcyECVwXbbxhWJ6xqBATRxjTS5EK02q6XYJvbW2G_mX2R8yJdYHrC9ElPxavKbHoqTWRAazGuklFafIP_iFHL9QeHhH4uwe4CHzyRO6SXn1zv6hjbfWxIRjdn9Vy8phakYSf-zz7WuZr/s1600-h/weatherArcticSalinity.jpg


Clearly about the time that the Arctic ice began to melt, the sea became more salty. CO2 is not melting the ice; the underlying warm water coming into contact with the ice from beneath is what is melting the Arctic ice.


Why do the global warming hysteriacs NEVER, EVER tell you this? Is it because they simply are pushing a political agenda rather than real science?


Quaternary Revised


It has been decided to commence the quaternary at 2.6 million years before present in order to coincide with the beginning of the ice age and thus provide some significance.


Of course, this immediately asks a few questions but then previous lines did the same. I am most interested in establishing an association with the onset of the ice age and the closing of the Atlantic at the Equator if one properly exists.


I also think ice caps existed provided land was in place at the poles. It should now be possible to map land location somewhat, leaving room for crustal adjustments if any occurred. Land that straddled the poles deep in time should then show signs of such ice caps.


One thing though is of interest. Both the Antarctic cap and the Northern cap were intact for a very long time. The sea level was much lower as a result. I would like to determine it this effected the edge of the continental shelf in any way. It should not have, yet there is a coincidence there that is at least tantalizing


I think that we know enough to speculate on these matters safely and it may turn out that we can do a goods job of piecing together a proper history of polar and mountain glaciations. We know volcanoes hit heights of 10,000 feet. We also know that outside of the compression zones of the Andes and parts of the Alaskan Arc and the Himalayas and environs that other forms do not get much higher.


It is plausible that normal mountain building does not get much beyond 10,000 feet, and there is certainly plenty of that once you accept lower elevations.


Date of Earth's Quaternary age revised


by Staff Writers


London (UPI) Sep 23, 2009


http://www.terradaily.com/reports/Date_of_Earths_Quaternary_age_revised_999.html


The International Commission on Stratigraphy says it has revised the date of the start of Earth's prehistoric Quaternary Period by 800,000 years.


The London-headquartered commission -- the authority for geological science -- decided to end decades of controversy by formally declaring when the Quaternary Period started. The Quaternary age covers both the ice age and moment early man first started to use tools.


Researchers said Earth's history during the 18th Century was split into four epochs, Primary, Secondary, Tertiary and Quaternary. Although the first two have been renamed Paleozoic and Mesozoic, in that order, the second two have remained in use for more than 150 years.


"It has long been agreed that the boundary of the Quaternary Period should be placed at the first sign of global climate cooling," said University of Cambridge Professor Philip Gibbard, a commission member. "What we have achieved is the definition of the boundary of the Quaternary to an internationally recognized and fixed point that represents a natural event, the beginning of the ice ages on a global scale."


In 1983 the boundary was fixed at 1.8 million years, a decision which sparked argument since that point had no particular geological significance.


"For practical reasons such boundaries should ideally be made as easy as possible to identify all around the world. The new boundary of 2.6 million years is just that," Gibbard said.


The decision is detailed in the Journal of Quaternary Science.

Haast's Eagle


After all the weird critters we have recently unearthed, this one is easy. An over sized eagle with easy to catch large land birds is a pretty creditable ecological niche. That it picked off the odd human child is no surprise.


That man likely hunted it to swift extinction is a certainty. The feathers alone would cause that. The bird also had no place to hide. It would be spotted going to its nest and be easily vulnerable.


This also suggests that such large birds might have existed once globally until mankind showed up and took an interest. Or perhaps this bird was unable to fly the distance to reach Australia and it is locally unique.


The one observation that we can make is that large predators require similarly sized prey that is readily available. This was true for Pleistocene mega lions and cave bears. Once the big ones were driven to the wall they followed.


Legend of giant man-eating New Zealand eagle is TRUE


By Daily Mail Reporter


Last updated at 5:45 PM on 15th September 2009


A massive man-eating bird of prey from ancient Maori legend really did exist, according to new research.


Scientists have known about the existence of Haast's eagle for over a century based on excavated bones, but the behaviour of these giant birds was not clear.


As the eagles weighed up to 40 lbs some scientists presumed they were scavengers rather than the predators from mythology.


But a new study has revealed the eagle as a fearsome predator that probably swooped on flightless birds and even children from a high mountain perch.


Researchers Paul Scofield of the Canterbury Museum in New Zealand and Ken Ashwell of the University of New South Wales used computerised CT and CAT scans to reconstruct the size of the brain, eyes, ears and spinal cord of this ancient eagle.


This data was compared to values from modern predatory and scavenging birds to determine the habits of the extinct eagle.


Professor Scofield said the findings are similar to what he found in Maori folk tales.


'The science supports Maori mythology of the legendary pouakai or hokioi, a huge bird that could swoop down on people in the mountains and was capable of killing a small child,' he said.


The researchers also determined the eagle quickly evolved from a much smaller ancestor, with the body growing much more quickly than the brain. They believe its body grew 10 times bigger during the early to middle Pleistocene period, 700,000 to 1.8 million years ago.


'This work is a great example of how rapidly evolving medical techniques and equipment can be used to solve ancient medical mysteries,' Professor Ashwell said.


They wrote their conclusions in the peer-reviewed Journal of Vertebrate Paleontology.


Scientists believe the Haast's eagle became extinct due to habitat destruction and the extinction of its prey species at the hands of early Polynesian settlers.


New Zealand paleontologist Trevor Worthy said: 'They provide a convincing case that the body of this eagle has rapidly enlarged, presumably adapting to the very much larger prey it had access to in New Zealand, but that the brain size had lagged behind this increase.'


Before the humans colonized New Zealand about 750 years ago, the largest inhabitants were birds like the Haast's eagle and the moa.


Friday, September 25, 2009

Meteorite Strike Exposes Martian Water

Above: A fresh, 6-meter-wide, 1.33-meter-deep crater on Mars photographed on Oct. 18, 2008, and again on Jan. 14, 2009, by Mars Reconnaissance Orbiter's HiRISE camera. The bright material is ice, which fades from Oct. to Jan. because of sublimation and obscuration by settling dust.


Above: This map shows five locations where fresh impact cratering has excavated water ice from just beneath the surface of Mars (sites 1 through 5) and the Viking Lander 2 landing site (VL2), in the context of color coding to indicate estimated depth to ice.

This is very heartening news from Mars. We obviously have large reservoirs of water stored in surface ponds only moderately covered by protective dust. That certainly means that establishing a working exploration base has become feasible. Assuming an energy source is brought along it is simple engineering to put up atmospheric bubbles to produce a living environments for human occupation that is potentially self sustaining in terms of the basics of life.

The main issue was access to water at all and in fact access to ample supplies was necessary for a sustained major effort. This requirement now appears amply satisfied. Of course, we might be looking at a lot of sublimated water adhering to the underlying dust exposed by the impact, yet there will still be plenty of water.

Sublimated onto sand grains is the most likely explanation since any solid ice would be wind swept and fully exposed. This also explains the quick change of color.

This broadly confirms that establishing a presence on Mars will mean mostly moving materials, initial supplies and a powerful energy source. This can be done through a stream of small cargos on Landers, if nothing else is then possible.

Not likely, but establishing a base on Mars could be more practical that one on the moon were even water must be delivered. At least the initial availability of key raw materials for life cuts the operating costs to manageable levels.

It also opens the door for sending an initial team on what could be a deliberate one way trip to build out the station and set up equipment as it is landed. Once enough is built out, it then would become possible to retrieve them by landing the components of a return craft. It is not pretty, but it could just make it feasible in the first place.
This option becomes possible because of ample water availability from the very beginning.

Martian Ice Exposed by Meteorite Impacts

09.24.2009
http://science.nasa.gov/headlines/y2009/24sep_martianice.htm?list1109684

September 24, 2009: Meteorites recently striking Mars have exposed deposits of frozen water not far below the Martian surface. Pictures of the impact sites taken by NASA's Mars Reconnaissance Orbiter show that frozen water may be available to explorers of the Red Planet at lower latitudes than previously thought.

"This ice is a relic of a more humid climate from perhaps just several thousand years ago," says Shane Byrne of the University of Arizona, Tucson.

Byrne is a member of the team operating the orbiter's High Resolution Imaging Science Experiment, or HiRISE camera, which captured the unprecedented images. Byrne and 17 co-authors report the findings in the Sept. 25 edition of the journal Science.

"We now know we can use new impact sites as places to look for ice in the shallow subsurface," adds Megan Kennedy of Malin Space Science Systems in San Diego, a co-author of the paper and member of the team operating the orbiter's Context Camera.

So far, the camera team has found bright ice exposed at five Martian sites with new craters that range in depth from approximately half a meter to 2.5 meters (1.5 feet to 8 feet). The craters did not exist in earlier images of the same sites. Bright patches darkened in the weeks following initial observations, as freshly exposed ice vaporized into the thin Martian atmosphere.

The finds indicate water-ice occurs beneath Mars' surface halfway between the north pole and the equator, a lower latitude than expected in the dry Martian climate.

During a typical week, the spacecraft's Context Camera returns more than 200 images of Mars that cover a total area greater than California. The camera team examines each image, sometimes finding dark spots that fresh, small craters make in terrain covered with dust.
Checking earlier photos of the same areas can confirm a feature is new. In this way, the team has found more than 100 fresh impact sites.

An image from the camera on Aug. 10, 2008, showed apparent cratering that occurred after an image of the same ground was taken 67 days earlier. The opportunity to study such a fresh impact site prompted a look by the orbiter's higher resolution camera on Sept. 12, 2009, confirming a cluster of small craters.

"Something unusual jumped out," Byrne said. "We observed bright material at the bottoms of the craters with a very distinct color. It looked a lot like ice."

The bright material at that site did not cover enough area for a spectrometer instrument on the orbiter to determine its composition. "Was it really ice?" the team wondered. The answer came from another crater with a much larger area of bright material.

"We were excited [when we saw it], so we did a quick-turnaround observation," said co-author Kim Seelos of Johns Hopkins University Applied Physics Laboratory in Laurel, Md. "Everyone thought it was water-ice, but it was important to get the spectrum for confirmation."

Mars Reconnaissance Orbiter Project Scientist Rich Zurek, of NASA's Jet Propulsion Laboratory, Pasadena, Calif., said, "This mission is designed to facilitate coordination and quick response by the science teams. That makes it possible to detect and understand rapidly changing features."

The ice exposed by fresh impacts suggests that NASA's Viking Lander 2, digging into mid-latitude Mars in 1976, might have struck ice if it had dug only 10 centimeters (4 inches) deeper. The Viking 2 mission, which consisted of an orbiter and a lander, launched in September 1975 and became one of the first two space probes to land successfully on the Martian surface. The Viking 1 and 2 landers characterized the structure and composition of the atmosphere and surface. They also conducted on-the-spot biological tests for life on another planet.

To view images of the craters and learn more about the Mars Reconnaissance Orbiter visit
http://www.nasa.gov/mro.