
This type of statistical analysis is much more convincing than much that has been trotted out. When you are working through an uptrend in the data, this is exactly what one expects to encounter and it acts as a good check on the authenticity of the measured uptrend.
What it fails to do is confirm the authenticity of the data itself which has been badly compromised by siting degradation that is way worse than anyone ever anticipated. Folks really do build air conditioning unit next to measuring devices and no one properly corrects for it all. A sampling was done and it was discovered that two thirds of the stations were compromised, some very badly.
And of course the error was always to the upside.
However, there is still very good reason to think that we have had a significant lift in temperature or more properly the overall heat content of the northern hemisphere is slightly higher than two decades ago even though there is signs of weakening.
Quantizing this heat quotient into gigajoules or whatever unit is convenient has never been practical. The progressive application of some of those heat units in the Arctic is presently very visible and is certainly linked more to the surface water in the arctic than the atmosphere.
In fact an expansion of warm surface water in both the Atlantic and the Pacific as observed is a creditable explanation for the present warmer climate. Such expansion may well be the result of a slower counter current at work in the Northern hemisphere.
There may be a working mechanism between the counter current and the Antarctic climate cycle that is presently difficult to discern. My point is that the tools are there and we may some evidence of variation.
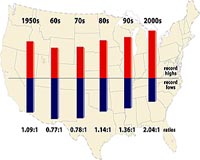
Record High Temperatures Far Outpace Record Lows Across
http://www.terradaily.com/images/usa-high-low-temps-1950s-to-2000s-bg.jpg
This graphic shows the ratio of record daily highs to record daily lows observed at about 1,800 weather stations in the 48 contiguous United States from January 1950 through September 2009. Each bar shows the proportion of record highs (red) to record lows (blue) for each decade. The 1960s and 1970s saw slightly more record daily lows than highs, but in the last 30 years record highs have increasingly predominated, with the ratio now about two-to-one for the 48 states as a whole. (UCAR, graphic by Mike Shibao.)
by Staff Writers
Spurred by a warming climate, daily record high temperatures occurred twice as often as record lows over the last decade across the continental
"Climate change is making itself felt in terms of day-to-day weather in the
The study, by authors at NCAR, Climate Central, The Weather Channel, and the National Oceanic and Atmospheric Administration (NOAA), has been accepted for publication in Geophysical Research Letters. It was funded by the National Science Foundation, NCAR's sponsor, the Department of Energy, and Climate Central.
If temperatures were not warming, the number of record daily highs and lows being set each year would be approximately even. Instead, for the period from January 1, 2000, to September 30, 2009, the continental
A record daily high means that temperatures were warmer on a given day than on that same date throughout a weather station's history. The authors used a quality control process to ensure the reliability of data from thousands of weather stations across the country, while looking at data over the past six decades to capture longer-term trends.
This decade's warming was more pronounced in the western
The study also found that the two-to-one ratio across the country as a whole could be attributed more to a comparatively small number of record lows than to a large number of record highs. This indicates that much of the nation's warming is occurring at night, when temperatures are dipping less often to record lows. This finding is consistent with years of climate model research showing that higher overnight lows should be expected with climate change.
More records ahead
In addition to surveying actual temperatures in recent decades, Meehl and his co-authors turned to a sophisticated computer model of global climate to determine how record high and low temperatures are likely to change during the course of this century.
The modeling results indicate that if nations continue to increase their emissions of greenhouse gases in a "business as usual" scenario, the U.S. ratio of daily record high to record low temperatures would increase to about 20-to-1 by mid-century and 50-to-1 by 2100. The mid-century ratio could be much higher if emissions rose at an even greater pace, or it could be about 8-to-1 if emissions were reduced significantly, the model showed.
The authors caution that such predictions are, by their nature, inexact. Climate models are not designed to capture record daily highs and lows with precision, and it remains impossible to know future human actions that will determine the level of future greenhouse gas emissions.
The model used for the study, the NCAR-based Community Climate System Model, correctly captured the trend toward warmer average temperatures and the greater warming in the West, but overstated the ratio of record highs to record lows in recent years.
However, the model results are important because they show that, in all likely scenarios of future greenhouse gas emissions, record daily highs should increasingly outpace record lows over time.
"If the climate weren't changing, you would expect the number of temperature records to diminish significantly over time," says Claudia Tebaldi, a statistician with Climate Central who is one of the paper's co-authors. "As you measure the high and low daily temperatures each year, it normally becomes more difficult to break a record after a number of years. But as the average temperatures continue to rise this century, we will keep setting more record highs."
An expanding ratio
The study team focused on weather stations that have been operating since 1950. They found that the ratio of record daily high to record daily low temperatures slightly exceeded one to one in the 1950s, dipped below that level in the 1960s and 1970s, and has risen since the 1980s. The results reflect changes in
Even in the first nine months of this year, when the United States cooled somewhat after a string of unusually warm years, the ratio of record daily high to record daily low temperatures was more than three to two.
Despite the increasing number of record highs, there will still be occasional periods of record cold, Meehl notes.
"One of the messages of this study is that you still get cold days," Meehl says. "Winter still comes. Even in a much warmer climate, we're setting record low minimum temperatures on a few days each year. But the odds are shifting so there's a much better chance of daily record highs instead of lows."
Millions of readings from weather stations across the country
The study team analyzed several million daily high and low temperature readings taken over the span of six decades at about 1,800 weather stations across the country, thereby ensuring ample data for statistically significant results.
The readings, collected at the National Oceanic and Atmospheric Administration's National Climatic Data Center, undergo a quality control process at the data center that looks for such potential problems as missing data as well as inconsistent readings caused by changes in thermometers, station locations, or other factors.
Meehl and his colleagues then used temperature simulations from the Community Climate System Model to compute daily record highs and lows under current and future atmospheric concentrations of greenhouse gases.
The University Corporation for Atmospheric Research manages the National Center for Atmospheric Research under sponsorship by the National Science Foundation
Any opinions, findings and conclusions, or recommendations expressed in this publication are those of the author(s) and do not necessarily reflect the views of the National Science Foundation.
1 comment:
"The study also found that the two-to-one ratio across the country as a whole could be attributed more to a comparatively small number of record lows than to a large number of record highs. This indicates that much of the nation's warming is occurring at night, when temperatures are dipping less often to record lows. This finding is consistent with years of climate model research showing that higher overnight lows should be expected with climate change."
Actually, I think this is attributable to the growth of urban "heat islands." An increase in the amount of concrete and asphalt which stores heat acquired during the day and released again at night; thus leading to higher low temperatures while having little or no effect on daytime highs. As this would seem to be the most likely cause for the observed increase in night time temps, no other conclusions should be drawn until this possibility is (honestly) studied and disproved.
Post a Comment