The takehome is that our numbers are now as believable as those of the CCP. Seriously a real portion of our working population was effectively. pensioned off for two months. They are now coming back to work under various programs. This is June. The USA got on a roll in may in most states. Some places a month slower.
Fully operational will take two more months until the end of August and full traction by the end of October. Even good news will speed this up only a little.
Of course, lots of damage was done and rdstoration demanbds cash flow and brisk application of government funding. Think airlines for a worst case scenario.
The point is that the USA economy was asked to eat its capital for at least one quarter. Many balance sheets were wreacked and if you want those jobs back it will take a jump start in many cases. Just what do you do with all those unsold dressess? And CARS!!!
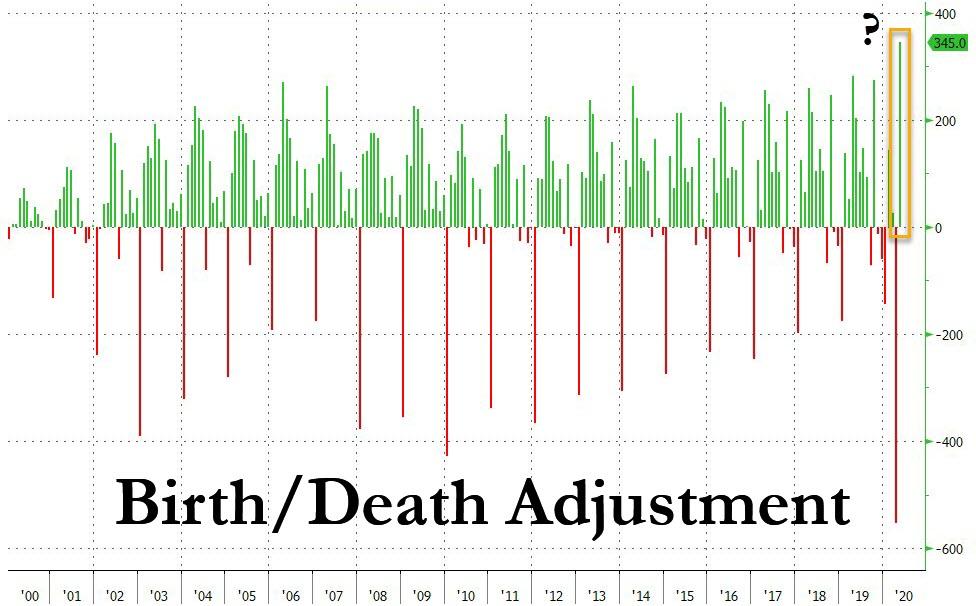
This Makes No Sense: In Month When US Was Shut Down, BLS Estimated 345K New Businesses Formed
JUNE 5, 2020
By Tyler Durden
As people dig deeper in the entrails of the most bizarre – and most politicized – jobs report in history, they keep finding more and more irregularities.
Consider this: according to the BLS report, which was based on a survey week from May 10th through May 16th when virtually all of the US was still shut down, the government decided that a record number of new businesses were formed. According to the BLS’s Birth/Death model which is used to adjust the raw payrolls data for estimated new business openings and closures, a record 345K new jobs were created due to new businesses opening in a month when – we will repeat again – the US was largely shut down! This also means that over 60% of the business closures from the month of April (April Birth/Death -553K) were somehow undone in a month when the US was still mostly closed down.
Needless to say, this was entirely a statistical adjustment in the “eye of the beholder”, one which even the BLS felt ashamed of, because in a little noticed addendum to the jobs report, the BLS announced it had made “changes” to its net birth-death model due to the coronavirus pandemic, changes which apparently included the modeling of massive business reopenings when millions of small businesses were shutting down. From the BLS:
These two methodological changes are the following:
A portion of both reported zeros and returns from zero in the current month from the sample were used in estimation to better account for the fact that business births and deaths will not offset.
Current sample growth rates were included in the net birth-death forecasting model to better account for the changing relationships between business openings and closings.
Firstly, BLS included a proportion of reports that fell to zero employment and reports that returned from zero employment in the current month in the over-the-month change of the sample-based estimates. Typically, reports with zero employment in either the previous or current month are not included in estimation. To account for an excess amount of reports going to zero employment as well as reports returning from zero employment, CES calculated the probabilities that either a reported zero or a return from zero exceeded what would be expected for the month. These “excess zeroes” and “excess returns from zero” partially account for drops in employment (when more business deaths than are usually observed in historical population data occur) and for increases in employment (when there are more business births than normal). More specifically, and due to time limitations for implementation, “excess zeroes” were used in our March final, April first and second preliminary, and May first preliminary estimates; “excess returns from zero” were used in our March final, April second preliminary, and May first preliminary estimates.
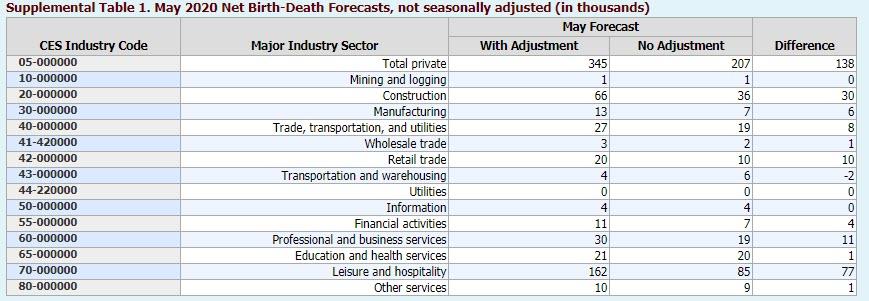
Secondly, BLS adjusted the portion of business births and deaths that cannot be accounted for using our sample data by including more recent information. Net birth-death forecasts are normally modeled using an auto-regressive integrated moving average (ARIMA) based on 5 years of historical birth-death residual values that end 9 months before the forecast of the current month. Instead of using only historical data—data that would not accurately account for how the labor market has changed due to COVID-19—a regression variable that includes data up to the current month was included in the model. The regression variable is the CES sample-based ratio of over-the-month change, known as the sample link, for each of the major industry sectors. Each major industry sector sample link was used for the basic-level industries only within that sector. Using additional regression variables in the net birth-death forecasts accounted for 345,000 in employment for May at the total private level .
The punchline from the above: “Using additional regression variables in the net birth-death forecasts accounted for 345,000 in employment for May at the total private level.” In short, instead of another 553K drop in jobs due to massive shutterings as was the case in April, the BLS decided to “add” 375K jobs because, well… it felt like it. And that is how you get an almost 1 million swing in monthly payrolls based on nothing more than a statistical revision.
But wait, there’s more.
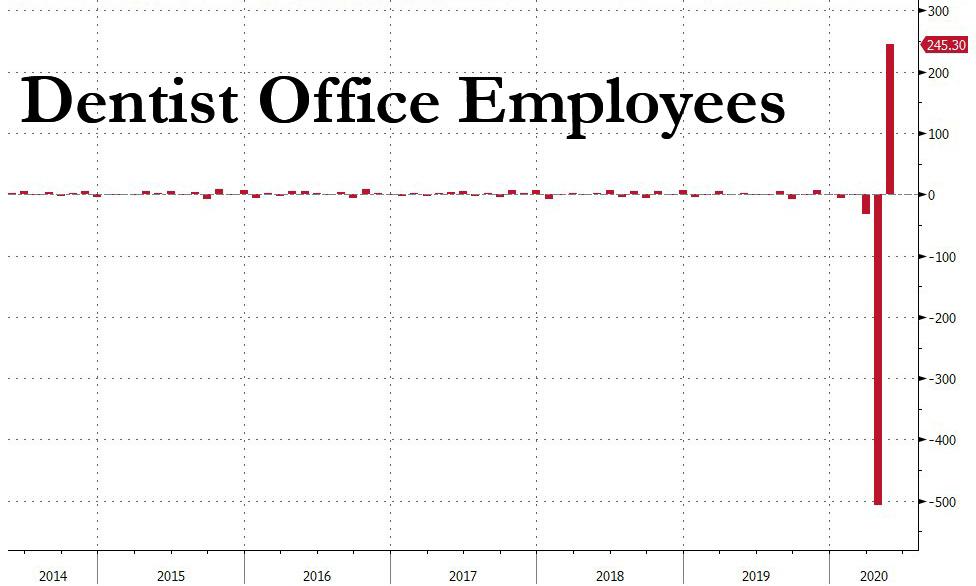
According to the American Dental Association, there are just over 200,000 dentists in the US. So how surprising it must be that at a time (as a reminder the survey week was from May 10th through May 16th) when most dental offices across the US were still shuttered (and in places like California they still are), a record 245K dentist office jobs were added, effectively undoing half of all the April job losses in this job category.
… there was also a large number of workers who were classified as employed but absent from work. As was the case in March and April, household survey interviewers were instructed to classify employed persons absent from work due to coronavirus-related business closures as unemployed on temporary layoff. However, it is apparent that not all such workers were so classified. BLS and the Census Bureau are investigating why this misclassification error continues to occur and are taking additional steps to address the issue.
If the workers who were recorded as employed but absent from work due to “other reasons” (over and above the number absent for other reasons in a typical May) had been classified as unemployed on temporary layoff, the overall unemployment rate would have been about 3 percentage points higher than reported (on a not seasonally adjusted basis).
How can one explain any of this? The only possible explanation is that after decades of China stealing US technology, the BLS finally reverse-engineered China’s own economic model spreadsheet where any “data” can be goalseeked to be exactly what one wants it to be.
Source: ZeroHedge


No comments:
Post a Comment