What became obvious from this report is that the seismic activity is clearly unrelated. Let us leave it there because apologists will hardly give up because of facts.
Montney Python’s Frac’ing Circus
Guest geology by David Middleton
In a recent post of mine (ExxonMobil & Chevron Eviscerate Democrat Frac’ing Ban Fantasies) I made this passing comment:
There is no evidence whatsoever that frac’ing has ever polluted groundwater or triggered palpable earthquakes.
Regarding my earthquake comment, I was referring to specific attribution, not generalized correlations. One very polite commentator from British Columbia was quite insistent that the BC government had proven that frac’ing is causing palpable earthquakes in BC… So insistent that he forwarded me a copy of a BC Oil & Gas Commission report (hat tip to PeterT). The report goes into great detail correlating the timing of frac’ing operations to the timing and epicenters of 2.5 to 4.4 ML earthquakes within up to 5 km of the frac’ing operations. Despite the fact that such tremors were associated with “only 0.15 per cent of wellbore stage completions during the investigation period”, they still determined that 193 tremors must have been caused by frac’ing. 99.85% of specific frac’ing operations were not even correlated with such tremors.
The Full Montney: Canada’s Marcellus
Montney tight natural gas production has literally exploded from nothing in 2006 to more than 30% of Canada’s natural gas production today.

It is currently projected that the Montney will account for nearly half of Canada’s natural gas production by 2040, with most of the growth occurring in the British Columbia portion of the play.
Is it physically possible for frac’ing to cause palpable earthquakes?
Yes it is possible.
Large-volume disposal of produced brine (Keranen et al. 2014; Schultz et al. 2014; Weingarten et al. 2015) or hydraulic fracturing (Schultz et al. 2015a, 2017;Atkinson et al. 2016; Bao&Eaton2016; Lei et al. 2017) can induce earthquakes by increasing pore pressure or stress on faults (Ellsworth 2013; Segall & Lu 2015). Necessary conditions for the occurrence of injection-induced seismicity include a source of elevated pore pressure, a proximal, critically stressed fault and a pathway for fluid pressure to propagate from the injection site to the fault (Ellsworth 2013; Eaton 2018). Extraction of hydrocarbons from unconventional low-permeability reservoirs, such as organic-rich shale, makes extensive use of hydraulic fracturing to increase reservoir permeability. Earthquakes have been observed in association with a small fraction of well completions (Atkinson et al. 2016), yet pre-development assessment is hindered by a paucity of validated predictive models to forecast site-specific seismic hazard. Of particular importance is the need to achieve a better understanding of specific geological factors that impact the likelihood of induced seismicity (Schultz et al. 2016; Ghofrani & Atkinson 2016; Pawley et al. 2018).Eaton & Schultz, 2018
One of the objectives in unconventional resource development is to avoid “proximal” faults of all varieties. Frac’ing into a fault is is a fast track to a junked & abandoned (J&A) wellbore. However, some faults are effectively impossible to resolve on reflection seismic data. You can’t avoid a fault, if you can’t see it.
That said, a lot of other factors can lead to induced seismicity.
In past decades, reported cases of induced seismicity in the WCSB (Western Canada Sedimentary Basin) have been attributed to stress changes from hydrocarbon production (Baranova et al., 1999), enhanced oil recovery (Horner et al., 1994), and wastewater disposal (Schultz et al., 2014).Atkinson et al., 2016
Atkinson et. al., 2016 established a statistical correlation between frac’ing and induced seismicity in the WCSB… And it might be valid… However…
However, validated predictive models are not yet available to assess the likelihood, rates, or magnitudes of induced events from specific operations (National Research Council, 2013).[…]The causative details of the correlation between hydraulic fracturing and seismicity, in terms of how it works on the level of specific wells, formations, and tectonic regimes are beyond our current scope, but can be explored in future case studies.Atkinson et al., 2016
They have a model and they have a statistical correlation… Sound familiar?
Has there been an increase in seismic activity in the vicinity of the Montney play?
It depends on location and time frame
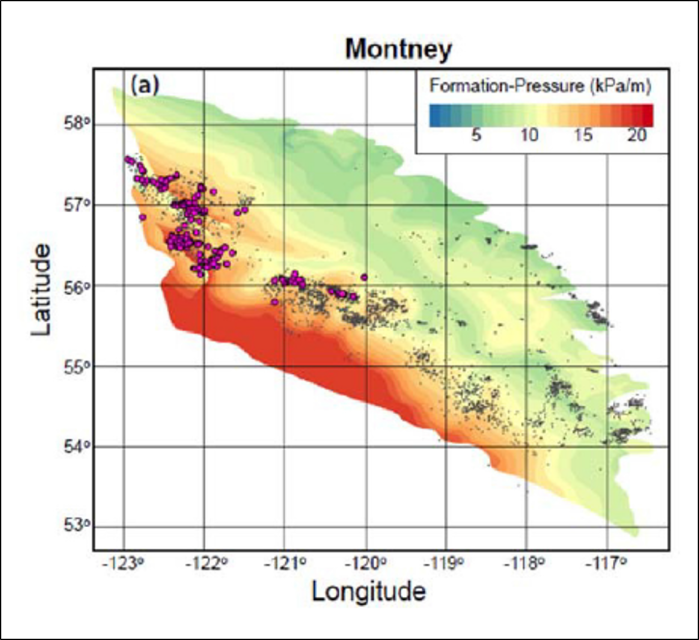
All of the increased assumed induced seismicity has occurred in the seismically active over-pressured portion of the play.
Fluid-injection processes such as disposal of saltwater or hydraulic fracturing can induce earthquakes by increasing pore pressure and/or shear stress on faults. Natural processes, including transformation of organic material (kerogen) into hydrocarbon and cracking to produce gas, can similarly cause fluid overpressure. Here we document two examples from the Western Canada Sedimentary Basin where earthquakes induced by hydraulic fracturing are strongly clustered within areas characterized by pore-pressure gradient in excess of 15 kPa/m. Despite extensive hydraulic-fracturing activity associated with resource development, induced earthquakes are virtually absent in the Montney and Duvernay Formations elsewhere.Eaton & Schultz, 2018
Natural Resources Canada has a searchable earthquake database (Earthquakes Canada). I downloaded the data for three time periods for the Lat-Lon range of the map in Figure 2. The database only includes 80 earthquakes from 1985-2019, far less than the 200+ induced quakes asserted by the BCOGC. The additional quakes were of too low magnitude to register in the national database.
As a result of recommendations from the investigation (Appendix 2), eight new seismograph stations (funded by the Commission, Geoscience BC, and the Canadian Association of Petroleum Producers) were added to
the existing two Canadian NationalSeismograph Network (CNSN) stations to provide more accurate detection and location capabilities. Six went online in August 2013, and two in November 2014. With the new stations the CNSN began recording many more lower magnitude events than previously recorded, enhancing the Commission’s ability to track seismicity. This report’s primary focus is on the investigation into events recorded between August 2013 and October 2014 in the Montney.The investigation found that during this period 231 seismic events in the Montney were attributed to oil and gas operations – 38 induced by wastewater disposal and 193 by hydraulic fracturing operations. None of the recorded events resulted in any injuries, property damage or loss of wellbore containment.BCOGC
There is no “before” in this data set from which to draw a baseline. Does this sound familiar? Directly comparing a recent high-resolution data set to the pre-existing low resolution data and declaring an anthropogenic anomaly… Very Mannian,
The BCOGC “found” 231 seismic events, attributed to oil & gas operations in the Montney between August 2013 and October 2014 . The Earthquakes Canada database only tabulates five (5) seismic events, of all causes, within the Montney over that time period. The Earthquakes Canada database appears to have a consistent resolution over its record length. There is no trend of detecting lower magnitude quakes over time. It is a reasonable “before and after” tool.
Prior to 2005, there was very little Montney production (“Pre-Montney”). The “Montney” time period is from January 1, 2005 to today. “Full Montney” is the period over which Montney production has boomed. I’m hard-pressed to see a statistically meaningful increase in seismic activity from Pre-Montney to Montney.
| Numbers of Quakes | ||||||
| Magnitude | ≤ 2 | 3 | 4 | 5 | ≥6 | |
| Pre-Montney | Feb 2, 1990 to Dec 31, 2004 | 27 | 20 | 4 | 1 | 0 |
| Montney | Jan 1, 2005 to November 25, 2019 | 8 | 11 | 5 | 0 | 0 |
| Full Montney | Jan 1, 2013 to November 25, 2020 | 6 | 3 | 5 | 0 | 0 |
| Quakes per Year | ||||||
| Magnitude | ≤ 2 | 3 | 4 | 5 | ≥6 | |
| Pre-Montney | Feb 2, 1990 to Dec 31, 2004 | 1.81 | 1.34 | 0.27 | 0.07 | 0.00 |
| Montney | Jan 1, 2005 to November 25, 2019 | 0.54 | 0.74 | 0.34 | 0.00 | 0.00 |
| Full Montney | Jan 1, 2013 to November 25, 2020 | 0.87 | 0.43 | 0.72 | 0.00 | 0.00 |
Here are maps of the three time periods:


I suppose a case could be made that the geographical distribution of earthquakes has shifted… if you want to grasp at straws. However, there hasn’t even been statistically meaningful change in the depths of earthquake epicenters. A shift from regional tectonic causes to anthropogenic causes, generally results in the epicenters becoming more shallow.

Can natural earthquakes be distinguished from frac-induced quakes?
Eaton et al., 2013 documented the detailed seismic monitoring of two frac’ing operations.
A research project was undertaken in August 2011 for continuous passive monitoring of a multistage hydraulic fracture stimulation of a Montney gas reservoir near Dawson Creek, B.C., with the main objective of investigating low-frequency characteristics of microseismic events. This work was motivated by a recently discovered class of long-period long-duration (LPLD) events, interpreted to represent slow slip along pre-existing fractures. The field deployment included a 6-level downhole toolstring with low-frequency (4.5 Hz) geophones and a set of 21 portable broadband seismograph systems. Time-frequency analysis of extracted high- and low-frequency microseismic events made use of the short-time Fourier transform. Observed low-frequency microseismic signals included tremor phenomena at various time scales, from a few seconds to the entire duration of high-pressure fluid injection, in addition to inferred regional earthquakes located ~150 km from the monitoring site. Relative to previously documented LPLD events from the Barnett, differences in low-frequency response for this Montney stimulation are interpreted to reflect a lower degree of complexity of preexisting and induced fracture networks. Analysis of low frequency microseismic signals shows promise for improving geomechanical understanding of fracture processes.Eaton et al., 2013
They found that microseismic events occurred throughout the operations.

Yes… The tremors had negative moment magnitudes.
How can an earthquake have a negative magnitude?Magnitude calculations are based on a logarithmic scale, so a ten-fold drop in amplitude decreases the magnitude by 1.If an amplitude of 20 millimetres as measured on a seismic signal corresponds to a magnitude 2 earthquake, then:–10 times less (2 millimetres) corresponds to a magnitude of 1;–100 times less (0.2 millimetres) corresponds to magnitude 0;–1000 times less (0.02 millimetres) corresponds to magnitude -1.An earthquake of negative magnitude is a very small earthquake that is not felt by humans.USGS
They did observe another phenomena which could be related to palpable earthquakes: “long-period long-duration (LPLD) events, interpreted to represent slow slip along pre-existing fractures. ” Unfortunately, they also recorded two natural earthquakes that had the same signature.
It is important to distinguish between potential LPLD events associated to the hydraulic fracturing treatment and local earthquakes. For example, Fig 12 shows a number of recorded signals that are interpreted here as regional earthquakes that are unrelated to this hydraulic fracture treatment.Eaton et al., 2013

Conclusions
It is effectively impossible to specifically attribute earthquakes to specific frac’ing operations. This 2011 Oklahoma Geological Survey report is the closest thing I have seen to constituting evidence of a specific frac’ing operation triggering a specific earthquake:
Determining whether or not earthquakes have been induced in most portions of the stable continent is problematic, because of our poor knowledge of historical earthquakes, earthquake processes and the long recurrence intervals for earthquakes in the stable continent. In addition understanding fluid flow and pressure diffusion in the unique geology and structures of an area poses real and significant challenges. The strong spatial and temporal correlations to the hydraulic-‐fracturing in Picket Unit B Well 4-‐18 certainly suggest that the earthquakes observed in the Eola Field could have possibly been triggered by this activity. Simply because the earthquakes fit a simple pore pressure diffusion model does not indicate that this is the physical process that caused these earthquakes.The number of historical earthquakes in the area and uncertainties in hypocenter locations make it impossible to determine with a high degree of certainty whether or not hydraulic-‐fracturing induced these earthquakes.Whether or not the earthquakes in the Eola Field were triggered by hydraulic-‐ fracturing these were small earthquakes with only one local resident having reported feeling them. While the societal impact of understanding whether or not small earthquakes may have been caused by hydraulic-‐fracturing may be small, it could potentially help us learn more about subsurface properties such as stresses at depth, strength of faults, fluid flow, pressure diffusion, and long term fault and earthquake behaviors of the stable continent. It may also be possible to identify what criteria may affect the likelihood of anthropogenically induced earthquakes and provide oil and gas operators the ability to minimize any adverse affects as suggested by Shapiro et al. (2007).Holland et al., 2011
Wastewater injection wells very likely have triggered induced seismicity, including some damaging quakes. It’s also likely that oil & gas formation, extraction and enhanced recovery processes can also induce seismicity. While it’s possible that frac’ing operations could directly trigger very minor earthquakes, there just isn’t any direct evidence for it… just models and statistical correlations.
References
Atkinson, G.M. et al., 2016. “Hydraulic fracturing and seismicity in the
Western Canada Sedimentary Basin”, Seismol. Res. Lett., 87, 631–647.
Western Canada Sedimentary Basin”, Seismol. Res. Lett., 87, 631–647.
B.C. Oil and Gas Commission (2014). “Investigation of Observed Seismicity
in the Montney Trend”, https://www.bcogc.ca/node/12291/download
in the Montney Trend”, https://www.bcogc.ca/node/12291/download
Eaton, David, et al. “Broadband Microseismic Observations from a Montney Hydraulic Fracture Treatment, Northeastern B.C.” CSEG RECORDER Magazine, 1 Mar. 2013, csegrecorder.com/articles/view/broadband-microseismic-observations-from-a-montney-hydraulic-fracture.
Eaton, David & Ryan Schultz. (2018). “Increased likelihood of induced seismicity in highly overpressured shale formations”. Geophysical Journal International. 214. 751-757. 10.1093/gji/ggy167.
Holland, A. “Examination of Possibly Induced Seismicity from Hydraulic Fracturing in the Eola Field, Garvin County, Oklahoma”. Oklahoma Geological Survey Open-File Report OF1-2011. August 2011.
“Montney Formation Play Atlas NEBC.” BC Oil and Gas Commission, 16 Jan. 2013, www.bcogc.ca/montney-formation-play-atlas-nebc.
National Energy Board. “Canada’s Energy Future 2018: Energy Supply and Demand Projections to 2040.” NEB, 28 Aug. 2019, www.cer-rec.gc.ca/nrg/ntgrtd/ftr/2018/index-eng.html.
No comments:
Post a Comment