This is important, though it may well be obscured by the melt water surge. I have argued for sometime that the global crust was shifted fifteen degrees south through Hudson Bay. we have plenty of conforming evidence, not least the current observed extent of ancient ice sheets. Clue - ice sheets cannot exist at sea level past fifteen degrees from the north Pole.
shifting the crust fixed this problem for both north and south poles.
Now we have a diatom explosion right were we need it in the core at arond 14000 years ago. No indication for this date would have been troubling.
Again we have plenty of conforming evidence based on a comet impacting the northern Ice Cap around 13900 BP. Geologists are slowly picking up on the evidence.
Ancient marine sediment DNA reveals diatom transition in Antarctica
Linda Armbrecht,Michael E. Weber,Maureen E. Raymo,Victoria L. Peck,Trevor Williams,Jonathan Warnock,Yuji Kato,Iván Hernández-Almeida,Frida Hoem,Brendan Reilly,Sidney Hemming,Ian Bailey,Yasmina M. Martos,Marcus Gutjahr,Vincent Percuoco,Claire Allen,Stefanie Brachfeld,Fabricio G. Cardillo,Zhiheng Du,Gerson Fauth,Chris Fogwill,Marga Garcia,Anna Glüder,Michelle Guitard,…
Nature Communications volume 13, Article number: 5787 (2022) Cite this article
Abstract
Antarctica is one of the most vulnerable regions to climate change on Earth and studying the past and present responses of this polar marine ecosystem to environmental change is a matter of urgency. Sedimentary ancient DNA (sedaDNA) analysis can provide such insights into past ecosystem-wide changes. Here we present authenticated (through extensive contamination control and sedaDNA damage analysis) metagenomic marine eukaryote sedaDNA from the Scotia Sea region acquired during IODP Expedition 382. We also provide a marine eukaryote sedaDNA record of ~1 Mio. years and diatom and chlorophyte sedaDNA dating back to ~540 ka (using taxonomic marker genes SSU, LSU, psbO). We find evidence of warm phases being associated with high relative diatom abundance, and a marked transition from diatoms comprising <10% of all eukaryotes prior to ~14.5 ka, to ~50% after this time, i.e., following Meltwater Pulse 1A, alongside a composition change from sea-ice to open-ocean species. Our study demonstrates that sedaDNA tools can be expanded to hundreds of thousands of years, opening the pathway to the study of ecosystem-wide marine shifts and paleo-productivity phases throughout multiple glacial-interglacial cycles.
Introduction
Polar ecosystems are highly vulnerable to ongoing climate change, and rapidly melting ice-sheets and changes in oceanography and in marine ecosystems are expressed on all levels of the food web1,2,3. Antarctica is arguably the most susceptible polar region to climate, evidenced in the fact that West Antarctica has warmed 2.4 ± 1.2 °C between 1958 and 2010, making it one of the fastest-warming regions globally4. Understanding how Southern Ocean organisms respond to climate variability, including throughout past climate shifts, is thus of key importance to predict how the Antarctic marine ecosystem will evolve in the near future.
Sedimentary ancient DNA (sedaDNA) analysis studies ancient genetic signals preserved in sediments. Because genetic traces of all organisms, fossilising and soft-bodied, can potentially be preserved in sediment records, the analysis of sedaDNA holds enormous potential to go beyond standard environmental proxies and allow reconstruction of entire ecosystems5,6. Yet, the recovery of sedaDNA is complicated, as only trace-amounts of DNA are preserved and they are fragmented and degraded, which makes sedaDNA prone to contamination from modern environmental DNA5,7. Recent improvements in sedaDNA techniques, including in anti-contamination measures during field work, laboratory work, and the use of bioinformatic DNA damage analysis, now permit authentication of sedaDNA detected in sediment samples6,8,9,10,11.
It is yet to be determined, however, how far back in time marine organisms can be detected using sedaDNA tools. So far, the oldest authenticated sedaDNA is from ~400,000-year-old terrestrial (cave) sediments12, and ~650,000-year-old subarctic permafrost deposits13. In polar marine ecosystems, eukaryote sedaDNA has been recovered from up to ~140,000-year-old sediments in the Arctic14,15,16 and <25,000-year-old sediments in the Antarctic7. Deep polar marine environments are ideal locations for sedaDNA research because of favourable DNA preservation14,15. They feature constantly low temperatures (~0 °C) and low oxygen (~5 mL L−1), and UV radiation is absent17,18,19.
In 2019, IODP Expedition 382 ‘Iceberg Alley and Sub-Antarctic Ice and Ocean Dynamics’ set out to investigate the long-term climate and oceanographic history of the Antarctic Ice Sheet (AIS). Five sites (U1534–U1538) were drilled east of the Drake Passage, two shelf sites at 53.2°S, the northern edge of the Scotia Sea (U1534, U1535), and three abyssal/deep sites at 57.4°–59.4°S in the Scotia Sea (U1536, U1537, U1538) (Fig. 1). Continuously deposited late Neogene sediments were recovered, which form the basis for ongoing investigations into reconstructing AIS mass loss and associated changes in oceanic and atmospheric circulation20,21,22,23.
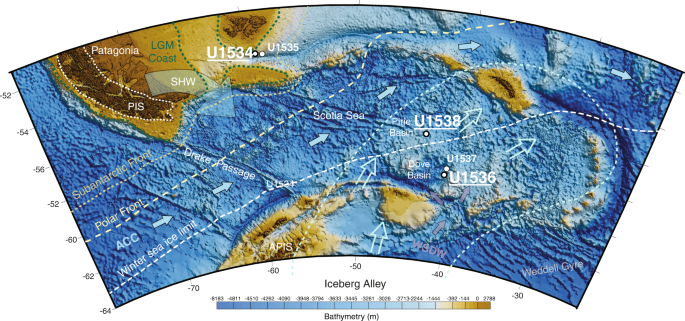
Fig. 1: IODP Exp. 382 Site Map.
Coring sites at which sedaDNA sampling was performed include U1534 (Falkland Plateau), U1536 (Dove Basin) and U1538 (Pirie Basin). Map adapted from IODP23 and created using ref. 60.
Here, we present a record of metagenomic marine sedaDNA from sediments deposited at the northern edge (U1534 - Falkland Plateau) and within the Scotia Sea (U1536 and U1538 – Dove and Pirie Basin, respectively, Fig. 1). Extensive anti-contamination precautions were taken, including clean sampling procedures, the application of chemical tracers to track potential contamination during the coring process24, performing laboratory protocols at dedicated ancient DNA facilities, and stringent data filtering combined with sedaDNA damage analysis for authenticity assessments of the sedaDNA data25 (and see Supplementary Information).
Results
Core sample contamination assessment via perfluoromethyldecalin (PFMD)
No traces of PFMD were detected at either the periphery (adjacent to core liner) or the centre of the here analysed cores from Sites U1534 and U1536. At Site U1538, PFMD was detected in 21 out of 31 samples from the core periphery (<1.2 ng mL−1), and three out of 31 samples from the core centre (<0.64 ng mL−1). All PFMD measurements are provided in Supplementary Table 1. Given that PFMD to drill fluid infusion rates were identical at Site U1534 and U1536, and PFMD was detected in samples from these Sites that are not part of this study (Supplementary Data 1), we deem the here analysed samples from U1534 and U1536 free of drill fluid contamination. Likewise, most samples at Site U1538 are considered free of contamination, while the results of three U1538 samples that showed traces of PFMD at the core centre should be interpreted with caution.
sedaDNA read assigned to the three domains using the taxonomic marker genes small (16 S/18S, SSU) and large subunit (23S/28S, LSU) ribosomal RNA SSU and LSU, and both SSU + LSU combined
A total of 297,002 reads were assigned to the three domains Bacteria, Archaea, and Eukaryota, using the combined SSU + LSU database (Fig. 2c and see Supplementary Information). When we compared the shotgun data against each of those databases alone, only a total of 142,299 and 189,724 reads were assigned to the three domains using SSU and LSU, respectively, confirming the usefulness of combining the databases prior to alignments (see also Supplementary Data 2). Linear regression analysis between relative abundances per taxon (phylum-level, average across all samples) detected via SSU, LSU and the combined SSU + LSU database showed strong positive relationships between the datasets (R2SSU,LSU = 0.72, R2SSU,SSU+LSU = 0.71, R2LSU,SSU+LSU = 0.90; Supplementary Information Fig. 1), as did Pearson correlation analysis (pSSU,LSU = 0.85, pSSU,SSU+LSU = 0.84, pLSU,SSU+LSU = 0.95; Supplementary Information Table 1), confirming that assignments based on the combined SSU + LSU database were in agreement with assignments based on each database alone. Slightly more taxa were detected using the combined SSU + LSU database (a total of 97 taxa compared to 81 and 84 taxa when using the SSU and LSU reference databases alone, respectively, Fig. 2), thus, we report here on the combined SSU + LSU data.
Fig. 2: Relative eukaryote abundance across all samples using SSU, LSU and SSU + LSU reference databases.
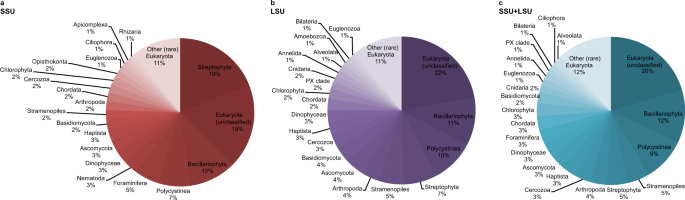
Pie charts were generated based on relative abundances (phylum level) determined after running shotgun data against the SILVA 132 SSU (a), LSU (b), and combined SILVA SSU + LSU (c) databases. Taxa that contributed <1% on average across all samples are summarised as’Other (rare) Eukaryota’. Source data are provided as a Source Data file.
sedaDNA-derived eukaryote composition at the three sites
At each site, we recovered very few eukaryote reads (0–2) from the mudline samples, maximum number of reads from intermediate depth samples (670 reads at U1534 5.46 mbsf, 7302 reads at U1536 4.46 mbsf, and 22,631 reads at U1538 12.05 mbsf), and few reads in the bottom-most samples (37 reads at U1534, 52 reads in our oldest sample from U1536, and 94 reads from our oldest sample at U1538, dated to ~0.7–2.5 Ma, 1 Ma, and 417 ka, respectively (for details on age determination see Methods section). Across all sites, Eukaryota (category not further classified) were the most abundant (~20% on average across all samples), followed by Bacillariophyta (diatoms, ~11.7%), Polycystinea (which include the Radiolarians, 9.5%), Stramenopiles (not further classified, 4.8%), Streptophyta (4.6%), Arthropoda (3.5%), Cercozoa (3.4%), Haptista (3.4%), Ascomycota (3.25%), Dinophyceae (3.2%), Foraminifera (3.1%), Chordata (3%), Chlorophyta (3%), Basidiomycota (2.3%), Cnidaria (1.5%), Euglenozoa (1.5%), Annelida (1.5%), PX clade (1.1%), Bilateria (1%), Ciliophora (1%) and Alveolata (1%) (Fig. 2). All other phyla contributed <1% on average across all samples to the eukaryote composition (Fig. 2). For details on taxonomy used and assignments see Methods section.
Using the SSU + LSU alignments, we identified eukaryotes in all but three samples, and found that eukaryote composition changed with depth at all three sites (Fig. 3). At all sites, Eukaryota (not further classified) contributed most of the assigned reads, followed by diatoms (Bacillariophyta). At Site U1538, the relative abundance of diatoms increased from <10% in sediments as old as 34 ka to ~50% of all eukaryotes in samples younger than 12.7 ka (with ~33% around 14.5 ka; Fig. 3c). The relative abundance of diatoms also increases in younger sediment at Site U1536, however, lower sampling resolution only allows the timing of this shift to be constrained between 53 and 4 ka (Fig. 3b). No obvious increase in the relative abundance of diatoms was observed using sedaDNA at Site U1534 (Fig. 3a). While most of our sedaDNA samples were younger than 540 ka, we examined the two samples with an estimated age of ~0.7–2.5 Ma (Site U1534) and ~1 Ma (U1536) and acquired few reads (37 and 52, respectively) and few taxa, primarily consisting of Fungi (Asco-, Basidio-, Chytridio- and Mucoromycota), unclassified Eukaryota, and a few rarer groups (e.g., Chordata, Metazoa, Cercozoa, PX clade, Streptophyta and Chlorophyta; Fig. 3a, b and Source Data File).
Fig. 3: Relative eukaryote abundance at IODP Exp. 382 Sites U1534, U1536, U1538.
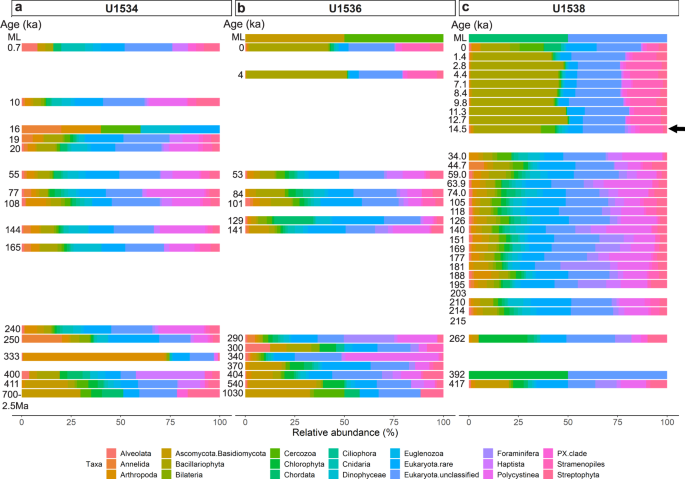
Relative abundance of eukaryotes is shown at phylum-level as derived from sedaDNA at Exp. 382 Sites U1534 (Hole C) (a), U1536 (Hole B) (b) and U1538 (Holes C and D) (c) post combined SSU + LSU alignment. Taxa abundant with at least 1% on average across all samples are shown separately, less abundant taxa are grouped as ‘Eukaryota.rare’. Left axis shows the estimated age (where an age but no bar is shown, no eukaryote reads were identified in that sample). For sample details see Table 1. ML = mudline. The arrow indicates the first sample in which the transition to an increased relative diatom (Bacillariophyta - olive) abundance was detected at Site U1538. Total eukaryote read count: 71,214 reads. Source data are provided as a Source Data file.
sedaDNA-derived abundance of photosynthetic organisms
We retrieved a total of 42 sequences (131 sequences in the non-subsampled data, see Supplementary Information Fig. 2) of the photosynthesis associated gene psbO, which were assigned to Chaetoceros, Chatocerotaceae, Chaetocerotophycidae, Coscinodicophyceae (Bacillariophyta); Chlorophyta, Coccomyxa and Micromonas (Chlorophyta) and Synechococcus (Cyanobacteria) (Fig. 4). At Site U1534, one read each was assigned to Synechococcus, identified in a sample from intermediate coring depths (~250 ka; Fig. 4a). At Site U1536, one read each was assigned to Micromonas (Chlorophyta) in two samples, including the second-oldest sample analysed at this site (~540 ka; Fig. 4b). Chlorophyta (including Micromonas and Coccomyxa) were detected irregularly throughout the core at Site U1538 (Fig. 4c), including in a ~188 ka sample. Two reads were assigned to diatoms in one of the upper U1536 samples (~4 ka, Fig. 4b), while at U1538 a clear increase in diatom psbO reads was detected from 12.7 ka to 11.3 ka (up to 10 reads per sample), after which read numbers decreased again (<3 reads in younger samples; Fig. 4c). Most of these diatom reads were assigned to Chaetocerotaceae (Fig. 4). The sudden increase in the diatom psbO gene at Site U1538 around 12.7–11.3 ka indicates increased diatom abundance and possibly intense blooming periods (especially, Chaetocerotaceae), which may have started sometime after 14.5 ka as increased diatom relative abundances determined by SSU + LSU suggests (see previous section).
No comments:
Post a Comment