
It goes without saying that predicting an ice free Arctic is a nervous business as this little tempest shows. I suspect that the models been worked on are not particularly robust and Dr. Wieslav Mawslowski is nervous over making too much of them
My own prediction of an ice free arctic been possible as early as 2012, made in 2007 was based on a simple extrapolation of known evidence for ice loss over the past half century. I have since come to understand that the observed loss is best explained by a simple increase in warmer surface water making its way into the Arctic on an annual basis.
Somewhere a switch was thrown a few decades ago and since then the sea ice has been eroded each and every year however you wish to interpret the areal extent of the known sea ice. The moment you assume a constant melt factor, the rest becomes quite easy.
What is then missed is that as we hit the last stage of sea ice collapse, that constant dominates and we have a swift breakup of the remaining ice.. This year it was revealed that the oldest ice is completely fragile and merely crumbles through wave action. It is turning into a larger form of slush.
This makes the 2012 target date even more probable than I first thought.
In the meantime, commentators are been distracted by shifting areal measures. There is a vast difference in ice conditions of 2006 and those of today. It is much thinner and it is now hugely shattered and broken up and is behaving as a breakup situation.
It is noteworthy that the atmosphere above the ice is possibly of far less significance than we has all been assuming. It represents about half the story and maybe a lot less.
Exclusive: Brochure reveals Gore accurately cited scientist's prediction of ice-free Arctic -- It is the Scientist who has the explaining to do -- not Gore
Climate Depot Exclusive
On December 14, former Vice President Al Gore told the UN climate summit that the Arctic could be ice free within a decade. “These figures are fresh. Some of the models suggest to Dr [Wieslav] Maslowskithat there is a 75 per cent chance that the entire north polar ice cap, during the summer months, could be completely ice-free within five to seven years,” Gore said.
But Dr. Maslowski essentially threw Gore under the bus, according to a December 15, 2009 article in the UK
“However, the climatologist whose work Mr. Gore was relying upon dropped the former Vice-President in the water with an icy blast. 'It's unclear to me how this figure was arrived at,” Dr. Maslowski said. 'I would never try to estimate likelihood at anything as exact as this.' Mr. Gore's office later admitted that the 75 per cent figure was one used by Dr. Maslowski as a 'ballpark figure' several years ago in a conversation with Mr. Gore.” The UK
But Climate Depot has obtained a handout on the Arctic that is being distributed by the Danish government that cites Dr. Maslowski's Arctic modeling and it appears to vindicate Gore's citation of Dr. Maslowski. The December 2, 2009 handout, published by the Danish Climate Centre is entitled “FreshNor The freshwater budget of the Nordic Seas.”
The Danish Climate Centre's brochure cites Maslowski's models and claims and reaches the same conclusion as Gore: “Projecting the trend into the future indicates that autumn could become near ice free between 2011 and 2016 (Maslowski, 2009).” This appears to vindicate Gore's assertions during his UN speech that Maslowski had made such a prediction. Maslowski is a research professor with theDepartment of Oceanography at the Navy Post Graduate School in Monterey, CA. [Climate DepotEditor's Note: The "prediction" of an ice-free Arctic is not "evidence" of anything other than an apparent attempt to gain media attention by Maslowski and Gore. When real world data fails to scare, make an alarming prediction. See: Arctic sea Ice GROWS by 'area one and a half times the size of Texas' – Sept. 20, 2009 & NYT: 'Spread of Thicker Arctic Ice Seen Last Summer' -- 'A substantial expansion of the extent of 'second year ice' - Oct. 6, 2009]
It appears that far from just a “'ballpark figure' several years ago in a conversation with Mr. Gore,” that Maslowski has indeed made this ice-free Arctic prediction much more formally and in model studies. Gore's version of events appears to be accurate, while Maslowski appears to be the one who has the explaining to do.
Climate Depot asked Maslowski about this controversy but had not received a reply by press time.
The colorful brochure issued by the Danish Climate Centre clearly cites Dr. Maslowski's research as predicting an ice free summer Arctic in the time frame Gore claimed. The brochure states: “Models indicate that sea ice thickness and volume have decreased possibly twice as much during the same period (Maslowski et al., 2007). Should the present trend of sea ice melt continue, some models suggest that theArctic Ocean
[Climate Depot's Editor's Note: The issue of whether Gore cited Maslowski's work accurately is a very serious one scientifically and ethically. It appears Maslowski did indeed tout his extreme model predictions of an ice-free Arctic within a decade or less and that Gore accurately cited his work. A larger point to be made though, is that Maslowski's “predictions” are nothing more than wild-eyedcomputer model scare scenarios.
This gives us a sense of the ocean of detail that is been integrated into interpretations. It does not give a sense of established and accepted pattern.
On Large Scale Shifts in the Arctic Ocean and Sea Ice Conditions during 1979-1998.
W. Maslowski , D.C.
Oceanography Department, Naval Postgraduate School , Monterey , California , USA
Results from a regional model of the Arctic Ocean and sea ice forced with realistic atmospheric data are analyzed to understand recent climate variability in the region. The primary simulation uses daily-averaged 1979 atmospheric fields repeated for 20 years and then continues with interannual forcing derived from the European Centre for Medium-range Weather Forecasts (ECMWF) for 1979-98. An eastward shift in the ice-ocean circulation, freshwater distribution and Atlantic Water extent has been determined by comparing conditions between the early 1980s and 1990s. A new trend is modeled in the late 1990s, and has a tendency to reverse the large scale sea ice and upper ocean conditions back toward their state from the early 1980s. Both the sea ice and the upper ocean circulation as well as fresh water export from the Russian shelves and Atlantic Water recirculation within the Eurasian Basin Arctic Ocean system. Interannual atmospheric variability appears to be the main and sufficient driver of simulated changes. The ice cover acts as an effective dynamic medium for vorticity transfer from the atmosphere into the ocean.
Introduction
Analysis of atmospheric SLP fields in the Northern Hemisphere for 1946-1997 suggests a regime change in the late 1990s (Johnson et al., 1999). The Arctic Oscillation (AO) index, defined as a time series of the leading EOF mode of wintertime SLP variability (Thompson and Wallace, 1998), shows a steady increase between the mid-1980s and the early 1990s followed by a sharp fall toward the end of the century. The North Atlantic Oscillation (NAO) index described by Hurrell (1996) has a generally similar trend during the last two decades. The positive buildup of these indices through the early 1990s can be characterized, among other things, by an increase of cyclonic activity (in magnitude, duration and frequency) over the Nordic/Barents Seas and extending into the central Arctic Ocean . The ice-ocean response to this regime has become evident from observations made in the early 1990s and it is believed to have begun in the late 1980s (e.g. Morison et al., 1998, McLaughlin et al., 1996, Steele and Boyd, 1998). Some coupled models of the Arctic Ocean and sea ice have simulated similar changes in ice-ocean circulation in response to prescribed realistic atmospheric forcing (Proshutinsky and Johnson, 1997, Zhang et al., 1998, Maslowski et al., 2000).
Two possible explanations of the cyclonic regime shift in the late 1980s / early 1990s can be suggested. One relates the changes in the sea ice and the upper ocean circulation to an increased northward heat flux due to higher temperatures and/or stronger northward transport of Atlantic Water carried from the North Atlantic into the Arctic Ocean . This hypothesis assigns the primary source of the changes in the Arctic Ocean to variability of the global ocean thermohaline circulation, which in our experiment we define as originating in the region outside the model domain. The other possible cause of the cyclonic regime shift in the ice-ocean system in the early 1990s involves variability of the "local" weather patterns over the northern polar region, as determined by one (AO) or possibly more principal modes of atmospheric variability. Major uncertainties remain about the role of ice-ocean processes that feed back to the arctic atmosphere and how these interactions influence arctic climate and its interannual to decadal variability.
Our model results discussed in the following sections are in support of the second hypothesis. Simulation of the cyclonic shift in the late 1980s / early 1990s has been described by Maslowski et al. (2000). Their model results for 1979-93 are in qualitative agreement with observations and show that the atmospheric interannual variability by itself can force a regime shift in the ice-ocean system as seen in the late 1980s / early 1990s. In this paper we emphasize results from a continuation of their earlier simulation for 5 more years (1994-98). In the following sections we briefly describe the coupled model and then discuss results from the late 1990s, their indication of a new trend in the ice-ocean circulation and its similarity to the state known from the 1970/1980s.
Model Description
The coupled Arctic Ocean and sea ice model employs the Parallel Ocean Program (Smith et al., 1992) adapted to the Pan-Arctic region and coupled to a parallel version of the Hibler (1979) dynamic-thermodynamic sea ice model with viscous-plastic rheology and a zero-layer thermodynamics approximation (Maslowski et al., 2000, Zhang et al., 1999). The model grid is configured in a rotated spherical coordinate system and its resolution is 1/6o (~18 km) with 30 levels. The model domain extends from Bering Strait through the Arctic Ocean into the sub-polar North Atlantic (to ~45oN) and it includes the Canadian Archipelago and the Nordic, Barents and Labrador Seas
Fresh water and Atlantic Water tracers are introduced at the beginning of the 20-year spinup with the 1979 annual cycle and they are integrated for a total of 40 years. Runoff from all the major Russian rivers, the Mackenzie River and Bering Strait inflow are marked with a separate "dye" tracer. This approach allows tracking of various water masses to determine their distribution, mixing and export from/into the Arctic Ocean . In addition we have completed two more reference integrations. One extends the 1979 20-year spinup for 20 more years. The other is a new experiment starting the dye tracer concentrations from zero after the initial 200-year spinup and integrating them for 10 years with the repeated 1997 followed by 30 years with the repeated 1998 annual cycle and it is discussed later. Those two runs are to verify that the regime shifts in the 1990s are truly the result of the prescribed interannual variability during the last two decades, not a model drift. Compared to the end of the 20-year spinup with the 1979 annual cycle, the ice-ocean circulation patterns remain qualitatively unchanged in the last 20 years of the 40-year run with the same atmospheric forcing. This indicates that the model drift (if any) is negligible and can not explain the modeled variability in the Arctic Ocean during 1979-98. Additional details about the model, forcing fields, experiment design and earlier results can be found in Maslowski et al. (2000), Zhang et al. (1999) and in Maltrud et al. (1999).
Results
In this section we describe model results as they represent large scale regime shifts in the sea ice and the upper ocean circulation during the last 2 decades. These results are analyzed in a qualitative sense mainly to determine relative variability and sign of simulated changes and not the absolute magnitudes of various properties. We argue that this approach allows for improved understanding of real changes in the ice-ocean system as it responds to the prescribed realistic atmospheric variability.
In the earlier integration covering the years 1979-1993 Maslowski et al. (2000) have simulated an eastward shift in the sea ice and the upper ocean circulation of the late 1980s / early 1990s, which is in qualitative agreement with observations. Their sea ice results for the late 1970s and 1980s have shown the typical large scale anticyclonic Beaufort Gyre covering the entire Canadian Basin Makarov Basin Makarov Basin
Continuation of the interannual run for 5 more years modifies the ice-ocean conditions of the early 1990s in such a way that they begin to resemble their state from the 1970s/1980s, suggesting a reversal of the regime associated with the early 1990s. To provide a clear picture of undergoing changes we have calculated differences between the 2-year means of ice velocity for 1991/92-1981/82 ( Figure 1a) and 1997/98-1991/92 (Figure 1b). In Figure 1a we have obtained a cyclonic pattern of the sea ice drift anomaly covering the entire Arctic Ocean . In Figure 1b the situation is an exact opposite. The first case represents an eastward regime shift of the sea ice circulation and the second shows the westward shift. In Figure 1c the difference between the mean ice drift of 1997/98 and 1981/82 is calculated. It shows significant differences in some regions but with no particular pattern. In addition, a comparison of the actual ice drift fields of the early 1980s (Figure 2a)and the late 1990s (Figure 2b) reveals a similarity between the two circulation regimes. A predominantly anticyclonic drift pattern in the Canadian Basin and the alignment of the Transpolar Drift transport through the Eurasian Basin in Figure 2b are not yet exactly the same as in Figure 2a. They are definitely quite different though from the mean ice drift of the early 1990s (see Figure 2b in Maslowski et al., 2000).
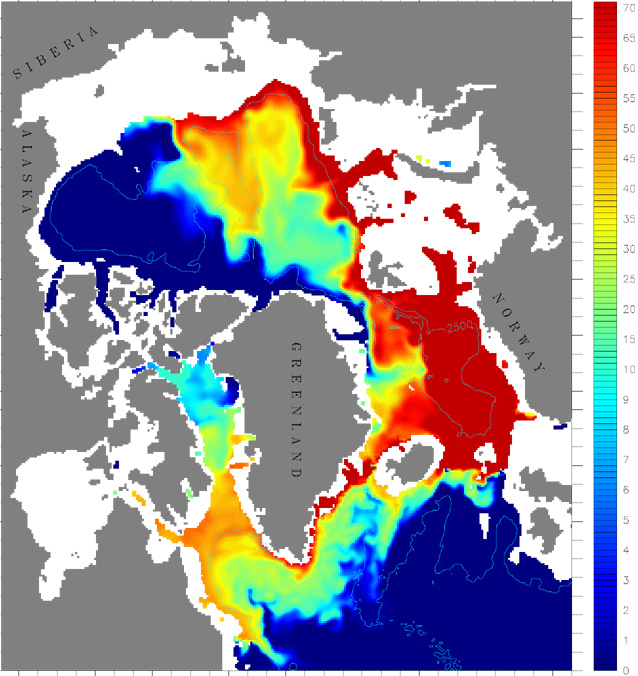
The distribution of fresh water as represented by dye tracers provides important information about the circulation at the surface down to the upper halocline layer and about the effectiveness of sea ice cover in transferring vorticity from the atmosphere to the ocean. The surface ocean salinity is also an important parameter from the point of view of sea ice thermodynamics as it determines the stability of the upper ocean and the freezing point temperature of sea water. The sea ice drift responds to atmospheric forcing on much shorter time scales than the ocean. Hence even in the upper ocean the change due to atmospheric variability can be delayed. The ocean requires longer time scales (from interannual to decadal) than sea ice to integrate synoptic to seasonal weather variability and to respond to it. To partly account for this delayed effect we analyze the distribution of total fresh water tracers in the upper 20 m at the end of 1983, 1993 and 1998, Figure 3a-c respectively.
The surface ocean circulation at the end of 1983 (Figure 3a) resembles the well-known pattern of the sea ice drift from the late 1970s / 1980s. The schematic circulation pattern at a given time has been determined from animations of monthly tracer distribution for 1979-1998. The anticyclonic Beaufort Gyre with minimum tracer concentrations in the center extends over the entire Canadian Basin Laptev Seas Kara Sea is advected eastward towards the East Siberian Islands Vilkitsky Strait and the other following the western side of the islands into the Voronin Trough to enter the Nansen Basin Eurasian Basin in two areas: the southern end of the Lomonosov Ridge and along the continental slope to the north of the East Siberian Islands Chukchi Sea there is a strong eastward flow along the northern coast of Alaska exiting into the Beaufort Sea along Barrow Canyon Baffin Bay . The dominant path for fresh water tracer export seems to be through Fram Strait
This picture changes dramatically by the end of 1993 (Figure 3b). The most noticeable change in the distribution of fresh water tracers is their significant accumulation in the Makarov Basin Arctic is clear. This pattern includes the increased eastward flow from the Kara Sea (through Vilkitsky Strait ) and from the Laptev Sea towards the Mendeleyev Ridge. A major portion of fresh waters from the Siberian shelves enters the deep basin there to be advected roughly along the Mendeleyev and Alpha Ridge system, towards Fram Strait Beaufort Sea . Finally, a significantly increased tracer transport exists through the Canadian Archipelago. There exists a well-established eastward boundary current carrying the fresh waters from the Chukchi Sea and the Mackenzie River into the Canadian Archipelago and towards Baffin Bay . This flow appears to develop in response to a reduced horizontal shear resulting from a partial collapse and/or weakening of the anticyclonic Beaufort Gyre circulation.
Five years later, by the end of 1998, the concentration of fresh water tracers in the Arctic Ocean suggests more changes in the upper ocean circulation (Figure 3c). Only half a decade later the eastward shift in the surface circulation of the central Arctic Ocean is not present. The dominant fresh water transport along the Lomonosov Ridge is re-established, similarly to the regime described in Figure 3a. High tracer concentrations are found in the Eurasian Basin , which again starts receiving most of the fresh water from the Kara and Laptev Seas Kara Sea and even in the southern Barents Sea occurs when at the same time only a limited eastward flow through Vilkitsky Strait to the Kara Sea
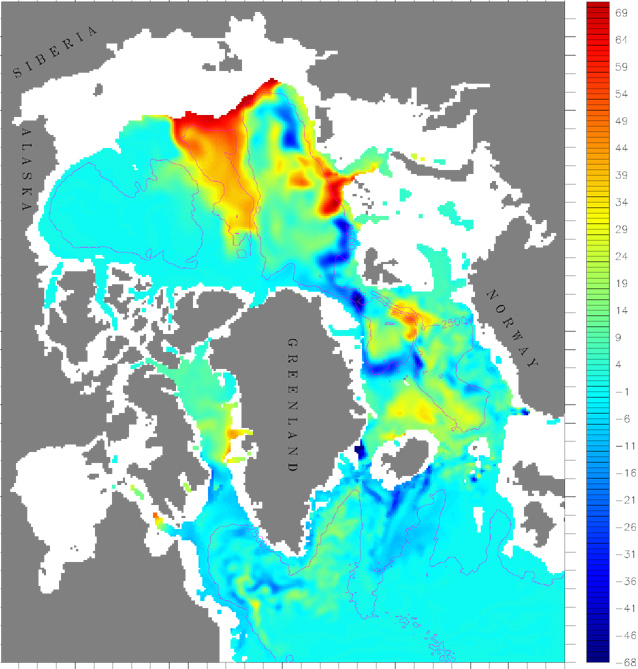
In order to determine the trend and spatial distribution of fresh water tracer anomalies, we calculated differences in tracer concentrations for 1993-1983 (Figure 4a) and 1998-1993 (Figure 4b). The changes that resulted due to the cyclonic shift between 1983 and 1993 are shown in Figure 4a. Positive/negative anomalies indicate regions with higher/lower concentrations of fresh water tracers in 1993 than in 1983. It is evident from this figure that in 1993 significantly more fresh water accumulated in the Canadian Basin and in the Makarov Basin Eurasian Basin and the northward shift of high tracer concentrations in the Chukchi and East Siberian Seas Laptev Sea northeastward toward the Mendeleyev Ridge. The dominant route of fresh water export from the Arctic Ocean seems to take place through the Canadian Archipelago to Baffin Bay . Increased export through Fram Strait is also apparent, which might be in part a result of a shorter tracer residence time in the Arctic Ocean in the early 1990s than in the 1980s.
The fresh water tracer anomalies between 1998 and 1993 are shown in Figure 4b. The main part of the Arctic Ocean has anomalies of opposite sign when compared with those from Figure 4a. Most importantly there is an increased accumulation of fresh water in the Eurasian Basin and a large deficit in the Makarov Basin Laptev Seas northward into the Eurasian Basin Makarov Basin in 1993 seem to move southward and then eastward in the Canadian Basin Nordic Seas Arctic Ocean decreased, which in turn suggests a longer residence time for these water masses in the late 1990s. It is important to note that the pattern of positive anomalies shown in Figure 4b to some degree resembles the modeled fresh water tracer distribution from 1983 (Figure 3a). Since Figure 4b can be interpreted as showing a 5-year trend after 1993, its resemblance of the actual circulation regime from the 1970s/1980s encourages us to make a prediction that we should return to similar conditions within 5 years or so. This is assuming an oscillatory behavior of the arctic climate.
Discussion
To verify that results from the 1979-98 interannual integration are actually in response to the prescribed atmospheric variability and not the model drift, we compare them against the 40-year reference integration with the repeated 1979 atmospheric forcing. The length of the reference run was chosen to be the same as in the interannual simulation, so year 35 and 40 of the reference run are equivalent to 1993 and 1998 of the interannual integration. The spreading of the Atlantic Water (AW) tracer from the Greenland-Scotland Ridge is contained to within the Eurasian Basin Makarov Basin
At the end of 1998 the AW tracer still dominates in the Makarov Basin but at the same time we see a significant increase in the recirculation of this tracer in the Eurasian Basin, as compared to 1993 (Figure 5). The difference in the AW tracer concentrations at 200 m between the end of 1998 and 1993 still has elevated positive concentrations over the Alpha and Mendeleyev Ridges and in the northern Beaufort Sea . At the same time higher concentration of AW tracer are also simulated in the Eurasian Basin Baffin Bay .
Having this powerful tool (i.e. the ice-ocean model), we can further explore the trend of changes modeled after 1993. A new experiment that helps to shed some more light on this topic is another integration for several decades with the repeated 1998 atmospheric cycle. We have completed this experiment starting from the end of the 200-year initial spinup and integrated the model for 40 years using the 1997 atmospheric data for the first decade and then continuing with the repeated 1998 cycle. Through the end of this integration the AW tracer remains contained within the Eurasian Basin
Summary and Conclusions
Using a regional, coupled ice-ocean model of the Pan-Arctic region forced with the prescribed atmospheric fields from ECMWF for 1979-98 we have simulated two large scale shifts in the ice-ocean circulation. A cyclonic shift is modeled in the late 1980s / early 1990s in qualitative agreement with observations. A new opposite trend in the late 1990s is predicted though it is yet to be verified with data. A continuation of model integration beyond the year 2000 with realistic atmospheric forcing is necessary to conclusively determine the pattern of recent changes. Atmospheric variability appears to be the dominant dynamic driver of modeled changes. The sea ice cover appears to be an effective medium for vertical momentum transfer from the atmosphere into the upper ocean. The energy flux from the arctic atmosphere into the sea ice and ocean provides sufficient forcing to drive changes qualitatively similar to those known from hydrographic observations. At the same time, the absence of the global interannual thermohaline forcing signal from outside of the model domain suggests that its influence on the recently observed changes has a secondary role. Such a conclusion, as yet unverified, requires use of global ice-ocean and climate models with proper representation of the Arctic Ocean and feed back processes between the atmosphere, the sea ice and the ocean underneath. On the other hand, results from this regional coupled ice-ocean model prove that global ocean and climate studies can no longer neglect the Arctic Ocean and its multi-year ice cover.
References
Hibler, W.D. III, 1979. A dynamic thermodynamic sea ice model, J. Phys. Oceanogr., 9, 815-846.
Hurrell, J., 1996. Influence of variations in extratropical wintertime teleconnections on Northern Hemisphere temperature. Geophys. Res. Lett., 23(6), 665-668.
Johnson, M.A., A.Y. Proshutinsky, and I.V. Polyakov, 1999. Atmospheric Patterns Forcing Two Regimes of Arctic Circulation: a Return to Anticyclonic Conditions? Geophys. Res. Lett., 26(11), 1621-1624.
Levitus, S., R. Burgett, and T. P. Boyer, 1994. World Ocean Atlas 1994, Volume 3: Salinity and Volume 4: Temperature, NOAA Atlas NESDIS 3 and 4, U.S. Dept. of Commerce , Washington
McLaughlin, F.A., E.C. Carmack, R.W. Macdonald, and J.K.B. Bishop, 1996. Physical and geochemical properties across the Atlantic/Pacific water mass front in the southern Canadian Basin
Morison, J., M. Steele, and R. Andersen, 1998. Hydrography of the upper Arctic Ocean measured from the nuclear submarine U.S.S. Pargo. Deep Sea Research I, 45(1), p.15-38.
Proshutinsky, A.Y. and M.A. Johnson, 1997, Two circulation regimes of the wind-driven Arctic Ocean , J. Geophys. Res., 102(C6), 12,493-12,514.
Smith, R.D., J.K. Dukowicz, and R.C. Malone, 1992. Parallel ocean general circulation modeling, Physica D, 60, 38-61.
Steele, M. and T. Boyd, 1998. Retreat of the cold halocline layer in the Arctic Ocean , J. Geophys. Res., 103(C5), 10,419-10,435.
Thompson, D.W.J. and J.M. Wallace, 1998. Arctic Oscillation signature in the wintertime geopotential height and temperature fields. Geophys. Res. Lett. May 1, 1998; 25(9), p.1297-1300.
Zhang, J., A. Rothrock, and M. Steele, 1998. Warming of the Arctic Ocean by a strengthened Atlantic inflow: model results. Geophys. Res. Lett., 25, 1745-1748.
Zhang Y., W. Maslowski, and A.J. Semtner, 1999. Impact of mesoscale ocean currents on sea ice in high-resolution Arctic ice and ocean simulations. J. Geophys. Res., 104, 18,409-18,429.
List of Figures
Figure 1: Two-year-average ice motion difference fields (cm s-1). (a) 1991/92 - 1981/82, (b) 1997/98 - 1991/92, and (c) 1997/98 - 1981/82. Depth contours are at 500 and 2500 m.
Figure 2: Two-year-average ice motion (cm s-1). (a) 1981/82, displaying strong anticyclonic ice motion and outflow, (b) 1997/98, displaying weaker, yet similar, anticyclonic flow.
Figure 3: Surface ocean circulation and total freshwater tracer distribution (percent concentration, 0-20 m), (a) at the end of 1983, (b) at the end of 1993, and (c) at the end of 1998. Depth contours are at 500 and 2500 m.
Figure 4: Total freshwater tracer anomaly distribution (percent concentration, 0-20 m). (a) 1993-1982 and (b) 1998-1993. Depth contours are at 500 and 2500 m.
Figure 5: Atlantic Water tracer anomaly distribution (percent concentration, 180-220 m) between the end of 1998 and 1993. Depth contours are at 500 and 2500 m.
(Submitted to Annals of Glaciology, 03/2000)
(Revised 08/16/00)
No comments:
Post a Comment