The clear take home is that the Little Ice Age was an event of the northern hemisphere and that all this is so far not Global. There is still solar variation and measuring that efect will demand much more refinement.
What is important here is that we have hard data that we can trust for the southern hemisphere. Variation sources should also be much simpler. Which begs the question of what to do with the data from the Northern Hemisphere whose trustworthiness is far more suspect.
Add in the impact of increasing greening from CO2 uptake and we are at sea. we have watched a short period of warming 1975 - 1995 generate heat which did spill over into the Arctic. That is now fading away and a drop in solar radiation is setting us up for a sharp chill in the northern hemisphere.
get ready to grow lots of barley and oats..
.
Longest-Ever S. Hemisphere Tree-Ring Reconstruction Finds The 1700s-1800s Were Warmer Than Today
By Kenneth Richard
https://www.climatedepot.com/2020/02/03/longest-ever-s-hemisphere-tree-ring-reconstruction-finds-the-1700s-1800s-were-warmer-than-today
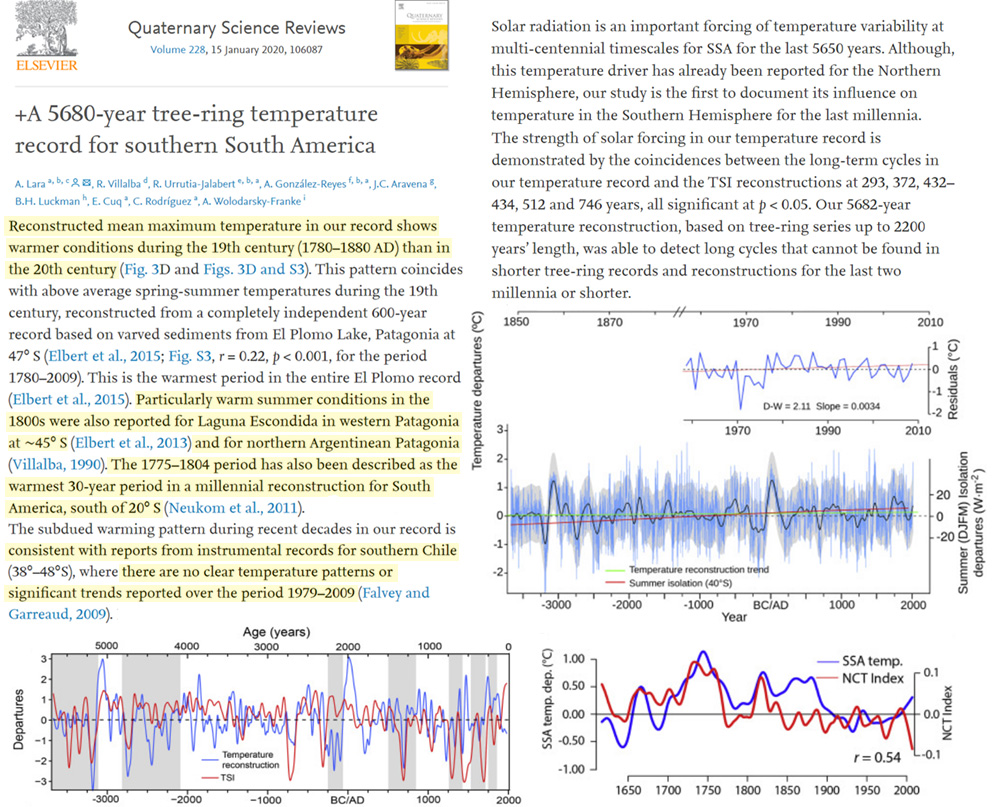
A new 5680-year tree-ring temperature reconstruction for southern South America (Lara et al., 2020)
reveals (a) no clear warming trend in recent decades, and (b) the 18th
and 19th centuries (and many centennial-scale periods from the last 5680
years) had much warmer temperatures than today.

Image Source: Lara et al., 2020
In addition to finding modern temperature changes in southern South
America fall well within the range of natural variability in the context
of the last 5680 years, Lara et al. (2020) assess solar forcing to have contributed to climate variations for this region of the Southern Hemisphere.
The authors find CO2 fertilization can explain trees’ improved water
use efficiency and tree-ring growth in general; this affects the
capacity for tree-rings to be a proxy for long-term temperature
variability.
They emphasize this composite tree-ring record is “the longest in the Southern Hemisphere.”
“The most outstanding features in the reconstruction presented here are two
major warm periods between 3140–2800 BC and 70 BC – 150 AD (5159–4819
and 2089–1869 years ago, respectively, counted from 2019 to
facilitate comparisons with glacier records based on 10Be dated
moraines). During these warm periods, no glacier advances have been
reported for Patagonia (Aniya, 2013; Kaplan et al., 2016; Strelin et
al., 2014, Fig. 5A).”
“Reconstructed mean maximum temperature in our record
shows warmer conditions during the 19th century (1780–1880 AD) than in
the 20th century (Fig. 3D and Figs. 3D and S3). This pattern
coincides with above average spring-summer temperatures during the 19th
century, reconstructed from a completely independent 600-year record
based on varved sediments from El Plomo Lake, Patagonia at 47° S (Elbert
et al., 2015; Fig. S3, r = 0.22, p < 0.001, for the period
1780–2009). This is the warmest period in the entire El Plomo record
(Elbert et al., 2015). Particularly warm summer conditions in the 1800s were also reported for Laguna Escondida in western Patagonia at ∼45° S (Elbert et al., 2013) and for northern Argentinean Patagonia (Villalba, 1990). The
1775–1804 period has also been described as the warmest 30-year period
in a millennial reconstruction for South America, south of 20° S (Neukom et al., 2011).”
“The subdued warming pattern during recent decades in our record
is consistent with reports from instrumental records for southern Chile
(38°–48°S), where there are no clear temperature patterns or significant trends reported over the period 1979–2009 (Falvey and Garreaud, 2009).”
Consistent with the patterns documented in this paper, low
frequency reconstructed cold temperature anomalies for the NH and
periods of minimal solar activity were variable with periods of
coincidences and discrepancies during the last 1200 years (Anchukaitis
et al., 2017). Changes in large scale NH circulation are thought to
provide a possible mechanism for these differences (Anchukaitis et al.,
2017). The two major periods with positive anomalies in our
reconstruction (3140–2800 BC and 70 BC-150 AD), coincide with positive
anomalies of solar irradiance, but the deviations in the TSI are proportionally smaller in the latter period (Fig. 5A).
“A strong CO2 fertilization effect has been the main
explanation for the significant increase in water-use efficiency (WUE)
reported for Northern Hemisphere temperate and boreal forests over the
recent two decades (Keenan et al., 2013).”
“The increasing growth trend and decreasing isotope
discrimination in Fitzroya have been attributed to a raise in
photosynthetic rates, which has been caused by increased CO2
and/or higher surface radiation, the latter associated with a reduction
in cloudiness in a high precipitation area (Urrutia-Jalabert et
al., 2015a). In the eastern slope of the northern Patagonian Andes,
Argentina, under lower rainfall and cloudiness than in the Chilean
western slope, a marked increase in Fitzroya tree-ring growth during the 20th century has also been recorded and attributed to increased CO2 concentration (Lavergne
et al., 2018). The coincident Fitzroya growth patterns in two areas of
contrasting cloud cover is an additional support for the attribution of
CO2 fertilization in this species.”
For good measure, Lara et al., (2020) point out that “a cooling
trend has been reported along the Pacific coast (17° – 37° S) of South
America for the periods 1979–2006 and 1981–2012 (Falvey and Garreaud,
2009; Hartmann et al., 2013).”
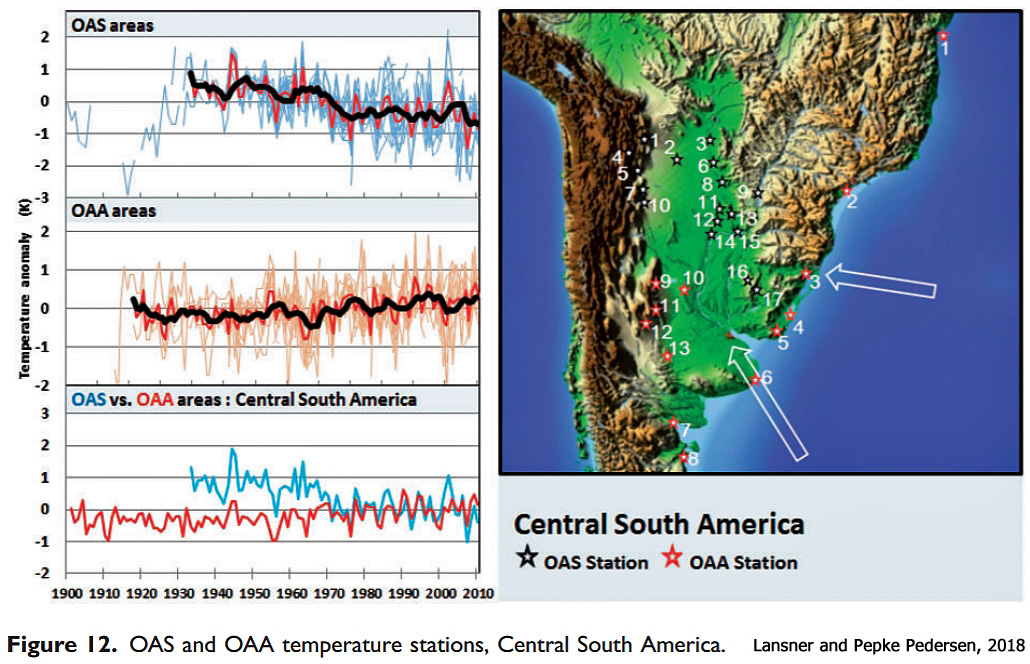
This cooling record is consistent with instrumental records from the
dozens of temperature stations all across the central and southern
regions of South America which also show cooling/no warming in recent
decades (Lansner and Pepke-Pedersen, 2018).

No comments:
Post a Comment