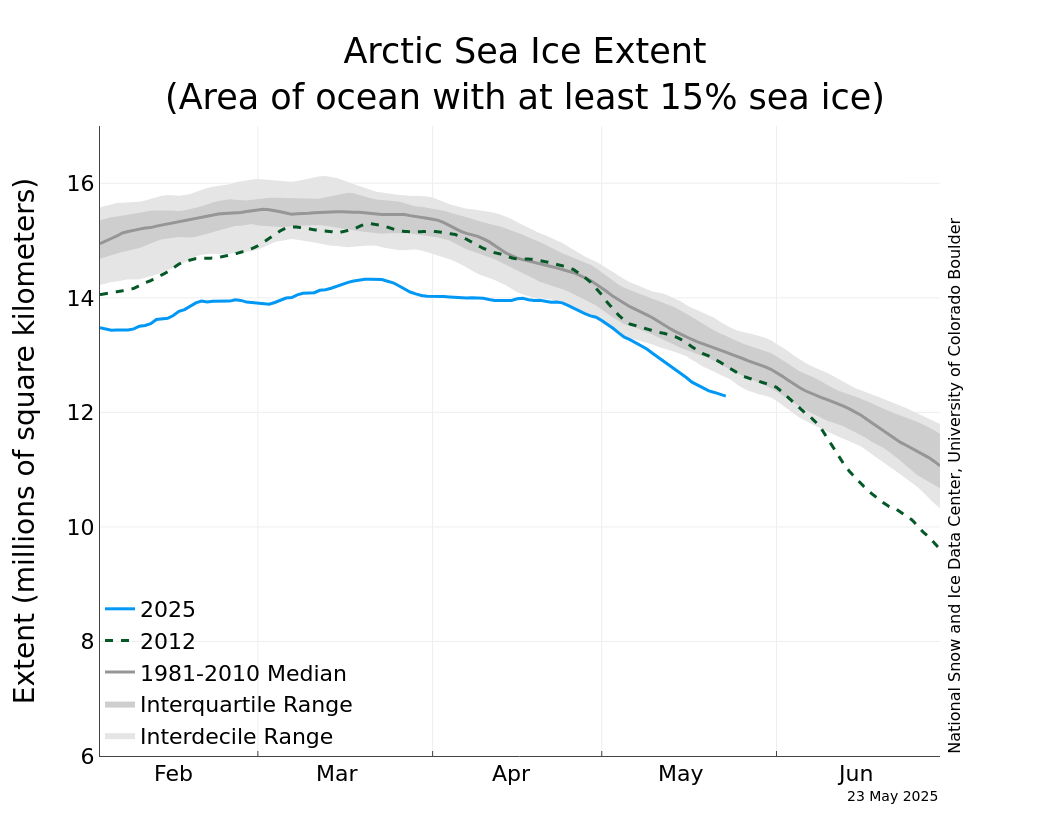
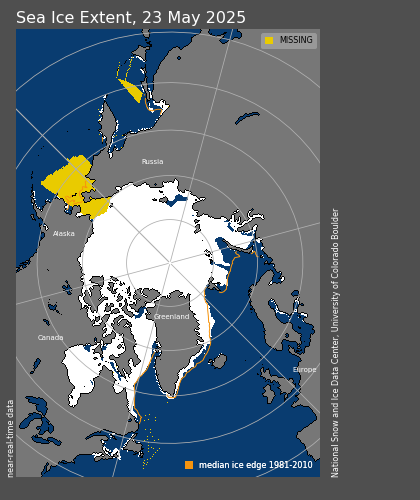
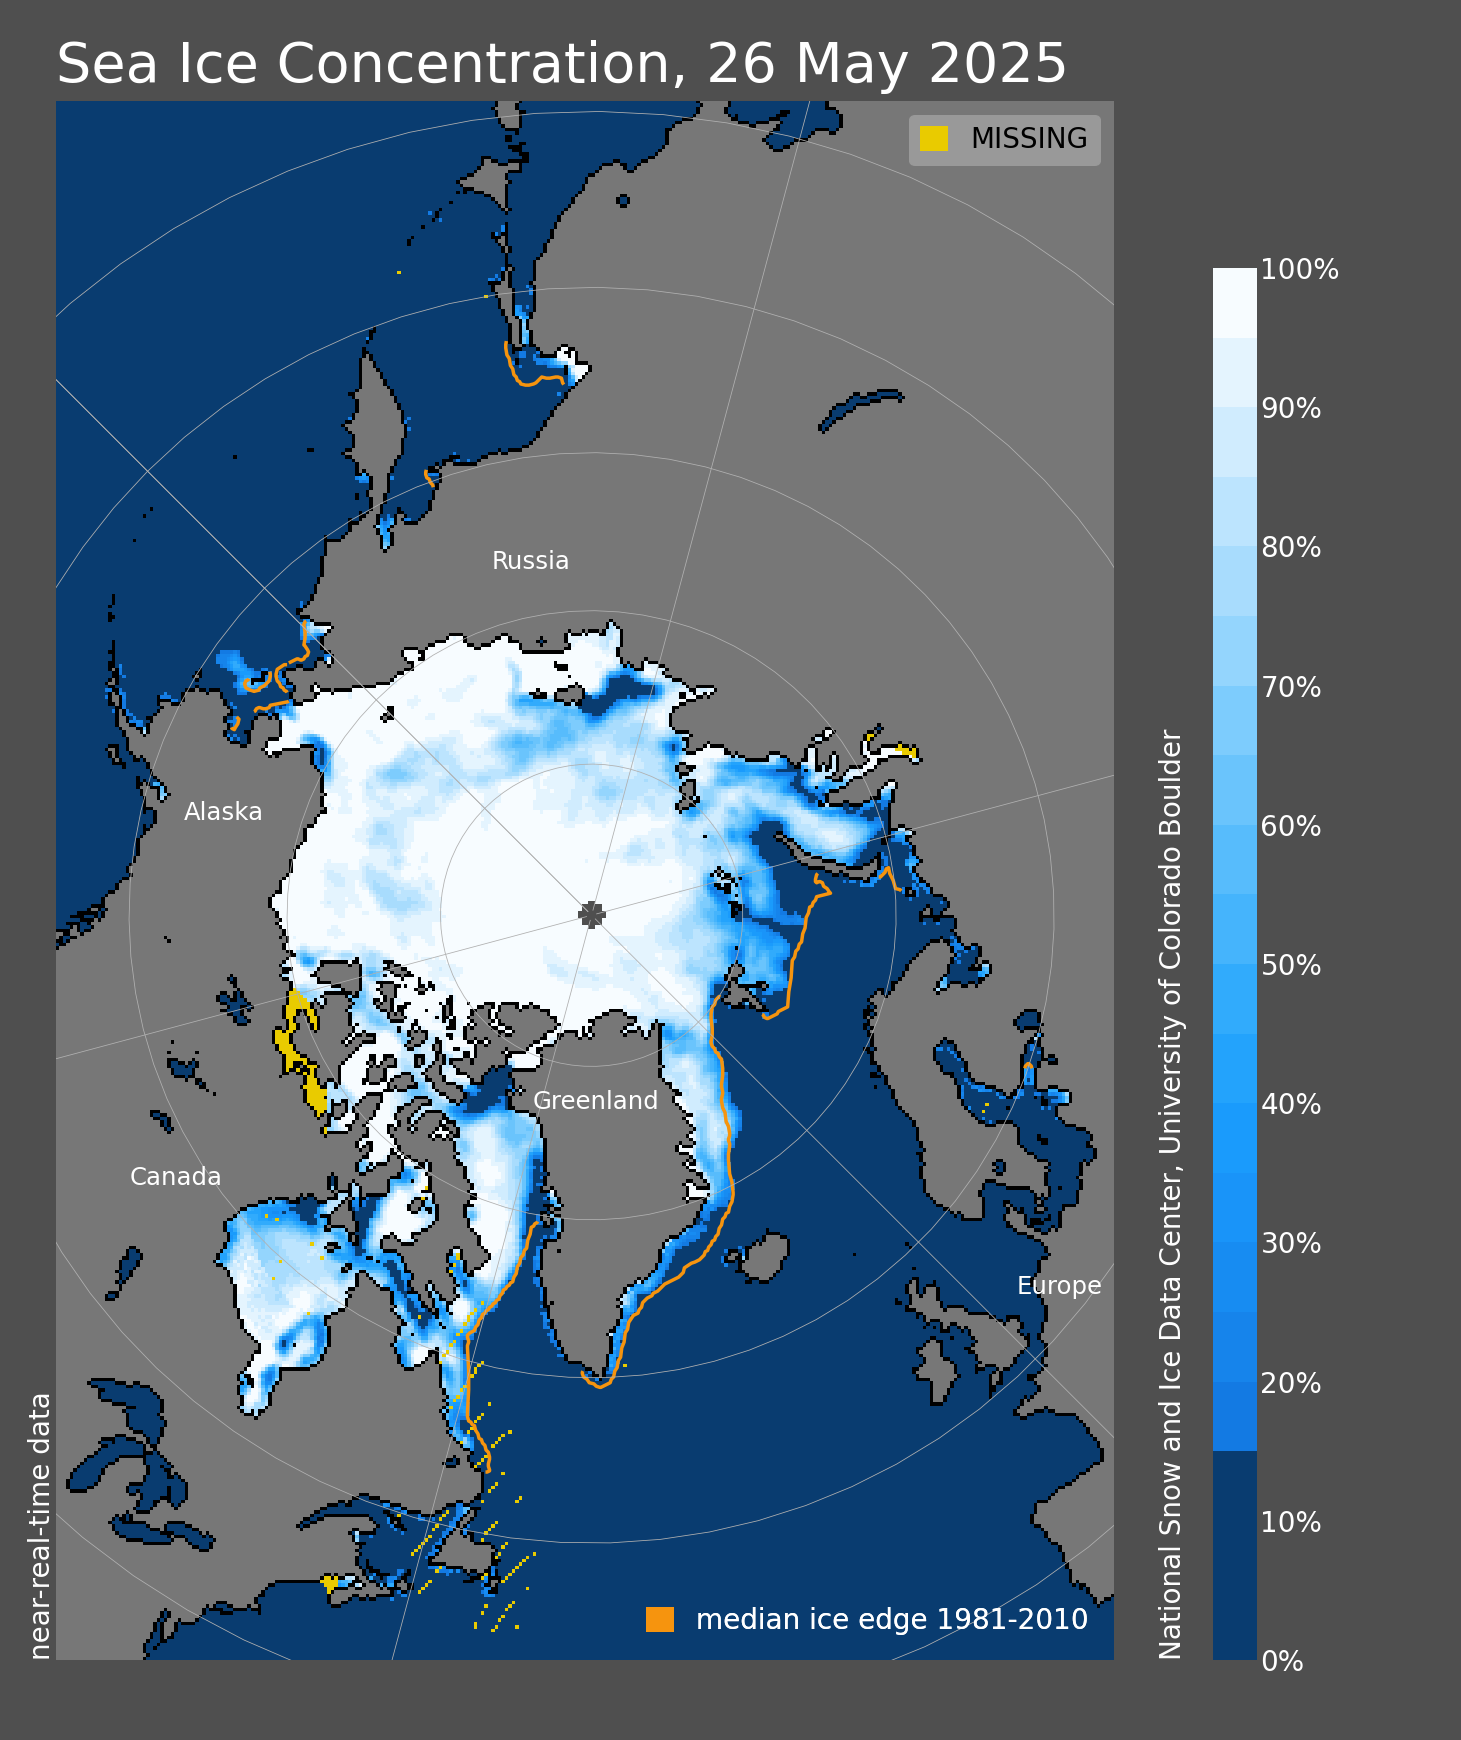
What has got me truly excited is the second image here. Observe just how all that multi year ice, once covering the majority of the central ice mass has been reduced to a skirt likely held in place against the norther coast of the arctic islands. The rest is moving and has been reduced as a body to eliminate multi year ice.
This is huge. All of this is likely now open to ice breaker penetration during the summer. More stunningly the North East passage is now the open North East trade GAP likely a thousand mi8les wide or some serious fraction thereoff. No longer a gamble at all.
The North West passage is still dicey so long as old ice hangs on along the coast. winds can blow ice in any time. Yet even that mass is showing signs of reduction. Warming Arctic sea water can truly open that all up as well.
There is no longer enough ice to shut the eastern route easily. This also means warmer waters are likely to now reach the Bering sea as well which will expand hte season there as vwell.
Sea Ice Conditions
http://nsidc.org/arcticseaicenews/
Read scientific analysis on Arctic sea ice conditions. We provide an update during the first week of each month, or more frequently as conditions warrant.
Following the sea ice extent minimum on September 15, 2020, expansion of the ice edge has been most notable in the northern Chukchi and Beaufort Seas. The ice edge along the Laptev Sea continued to retreat farther. Antarctic sea ice has climbed to its highest extent since 2014; it may have reached its maximum on September 28, but it is too soon to say for sure.
Overview of conditions
Figure 1. Arctic sea ice extent for September 2020 was 3.92 million square kilometers (1.51 million square miles). The magenta line shows the 1981 to 2010 average extent for that month. Sea Ice Index data. About the data
Credit: National Snow and Ice Data Center
Arctic sea ice extent averaged for September 2020 was 3.92 million square kilometers (1.51 million square miles), the second lowest in the 42-year satellite record, behind only September 2012. This is 350,000 square kilometers (135,000 square miles) above that record low, and 2.49 million square kilometers (961,000 square miles) below the 1981 to 2010 average. Following the minimum seasonal extent, which occurred on September 15, ice growth quickly began along in the northern Beaufort, Chukchi, and East Siberian Seas (Figure 1). Expansion of the ice edge was also notable within the East Greenland Sea and within Canadian Arctic Archipelago. By contrast, the ice edge in the Kara and Barents Seas remained relatively stable until the end of the month when it started to expand, and within the Laptev Sea the ice edge retreated slightly. The Northern Sea Route remained open at the end of September whereas the Northwest Passage southerly route (Amundsen’s route) is now blocked by ice. Ten days after the minimum extent was reached, the total extent climbed above 4 million square kilometers (1.54 million square miles) and by the end of the month the ice extent was tracking at 4.25 million square kilometers (1.64 million square miles), still second lowest in terms of daily extent.
Conditions in context
Figure 2a. The graph above shows Arctic sea ice extent as of October 4, 2020, along with daily ice extent data for four previous years and the record low year. 2020 is shown in blue, 2019 in green, 2018 in orange, 2017 in brown, 2016 in purple, and 2012 in dashed brown. The 1981 to 2010 median is in dark gray. The gray areas around the median line show the interquartile and interdecile ranges of the data. Sea Ice Index data.
Credit: National Snow and Ice Data Center
Figure 2b. The plot on the left shows the departure from average air temperature in the Arctic at the 925 hPa level, in degrees Celsius, for September 2020. Yellows and reds indicate higher than average temperatures; blues and purples indicate lower than average temperatures. The plot on the right shows average sea level pressure in the Arctic in millibars (hPa) for September 2020. Yellows and reds indicate high air pressure; blues and purples indicate low pressure. The apparent high pressure over Greenland is an artifact of the high elevation there; errors are incurred in extrapolating from the surface of the ice to sea level.
Credit: NSIDC courtesy NOAA Earth System Research Laboratory Physical Sciences Division
Arctic air temperatures at the 925 hPa level (about 2,500 feet above the surface) remained overall above the 1981 to 2010 average during September. This warmth was primarily observed on the Eurasian side of the Arctic, where air temperatures along the coastal regions of the Laptev Sea reached up to 8 degrees Celsius (14 degrees Fahrenheit) above average. Below average temperatures prevailed over Greenland. Warm conditions over the Siberian side of the Arctic were driven by a strong high pressure ridge over Siberia coupled with a strong low-pressure trough centered over Svalbard. This is also manifested as a positive phase of the Arctic Oscillation (AO). A cyclonic (counterclockwise) circulation pattern set up over the Laptev Sea, bringing in warmer air from the south. At the same time, this circulation pattern enhanced ice drift out through Fram Strait and out of the Arctic Ocean. Winds from the south in the Kara and Barents Seas also kept the ice edge from expanding in that region, and led to retreat of the ice edge within the Laptev Sea.
September 2020 compared to previous years
Figure 3. Monthly September ice extent for 1979 to 2020 shows a decline of 13.1 percent per decade.
Credit: National Snow and Ice Data Center
The overall rate of sea ice decline in September is now at 83,700 square kilometers (32,300 square miles) per year, or a rate of ice loss of 13.1 percent per decade relative to the 1981 to 2010 average.
A look back at summer 2020
Figure 4a. This graphic ranks months based on their Arctic air temperature from 1979 to 2020 at 925 hPa from the National Centers for Environmental Prediction/National Center for Atmospheric Research (NCEP/NCAR) Reanalysis for all areas north of 70 degrees N. Dark reds indicate warmest months; dark blues indicate coldest months.
Credit: Z. Labe, Colorado State University, Colorado
Figure 4b. This plot shows the departure from average air temperature in the Arctic at the 925 hPa level, in degrees Celsius, for May, June, July, and August 2020. Yellows and reds indicate higher than average temperatures; blues and purples indicate lower than average temperatures.
Credit: NSIDC courtesy NOAA Earth System Research Laboratory Physical Sciences Division
Figure 4c. These four plots show average sea level pressure in the Arctic in millibars (hPa) for May, June, July, and August 2020. Yellows and reds indicate high air pressure; blues and purples indicate low pressure.
Credit: NSIDC courtesy NOAA Earth System Research Laboratory Physical Sciences Division
Figure 4d. These maps show sea surface temperature (SST) in degrees Celsius and sea ice concentration for August 23, 2020 on the left and September 13, 2020 on the right. SST data are from the University of Washington Polar Science Center Upper layer Temperature of the Polar Oceans (UptempO) buoys and satellite-derived values from the National Oceanic and Atmospheric Administration (NOAA), and ice concentration is from the NSIDC Sea Ice Index.
Credit: University of Washington
While average and below average air temperature characterized the Arctic Ocean in the winter of 2019 to 2020, exceptionally warm conditions prevailed this past summer. Indeed, the summer of 2020 appears to be the warmest since at least 1979. According to the NCEP/NCAR reanalyses, monthly averaged air temperatures (at the 925 hPa level) over the Arctic Ocean, north of 70 degrees N, were at record highs in May, July, and August. June ranked as the second warmest behind 2005 (Figure 4a). Exceptionally high temperatures in May led to early development of melt ponds along the Russian coast (Figure 4b). This, combined with exceptional warmth over Siberia in June and thin ice in the region, fostered by the strongly positive phase of the Arctic Oscillation (AO) in winter (see discussion below), resulted in early development of open water within the Laptev Sea. This led to record low ice extent in the region starting in mid-June. By mid-July, Arctic sea ice extent was tracking at record lows over the period of satellite observations, fueled by the early ice retreat along the Russian coast.
Sea level pressure patterns this melt season shifted from month to month (Figure 4c). For example, high air temperatures in May were linked to a high pressure ridge over Alaska that extended into the Beaufort and Chukchi Seas. Meanwhile, unusually low pressure was focused over the central Arctic Ocean and Scandinavia, driving winds from the south over to the Kara Sea. In June, the high pressure moved over to the western Arctic Ocean. High pressure also developed throughout the Canadian Arctic Archipelago, Greenland, and Scandinavia. This, combined with low sea level pressure near the pole and over the Kara Sea and Eurasia, spilled cold Arctic air into Eurasia and warm air over Siberia. In July, the high pressure ridge moved further east to the Kara and Laptev Seas. Coupled with low pressure over Siberia and Scandinavia, this circulation pattern funneled warm air from Scandinavia and Eurasia towards the pole, while pushing cold Arctic air from the Kara Sea over to Russia and from the central Arctic over to Alaska.
As August started, the pace of ice loss slowed and by the end of the month, total Arctic sea ice extent went from the lowest to the second lowest in the satellite record. This was despite August being the warmest August recorded since at least 1979.
By late August, sea surface temperatures showed large variations across the Arctic, with generally warm water to the south and colder, near-freezing water near the ice edge in most locations (Figure 4d). According to our colleague Mike Steele at the University of Washington, this cold water persists near the ice edge as the ocean gives up its heat to melt ice; this signals the last stage of summer ice retreat. The resulting new open water hardly warms up because there is little atmospheric heating late in the season from lack of solar energy. An exception is the eastern Beaufort Sea, where ice was swept southward this year into warm water along the northern coast of northwest Canada and Alaska. By mid-September, the cold northern band of sea surface temperatures expanded in response to continued ice retreat and weak atmospheric heating of the ocean. Many areas, such as the Beaufort and Chukchi Seas, Canada Basin, and Baffin Bay, had lower sea surface temperatures at this time relative to August. This surface cooling happens as the calm winds of summer are replaced by windier conditions in the fall, which mixes the ocean heat downward. The date of maximum sea surface temperature is often earlier than the date of minimum sea ice extent. This is not so evident in the eastern Arctic Ocean, possibly because of the influence of warm ocean currents that continue to pump heat into the area through late summer.
Comment on the northernmost ice edge position in the Kara and Barents Seas
Figure 5. These graphs show the 3-month average Arctic Oscillation (AO) index from 1950 through August 2020.
Credit: National Centers for Environmental Prediction (NCEP) and National Oceanic and Atmospheric Administration
The near record minimum Arctic sea ice extent in September 2020, and particularly the loss of ice along the Russian margin of the Arctic Ocean, is consistent with wind patterns associated with the persistently strong positive phase of the Arctic Oscillation (AO) this past winter. During the positive phase of the winter AO, there tends to be a pattern of offshore winds along the Russian side of the Arctic, drawing ice out of the Siberian shelf seas (Kara, Laptev, East Siberian, and Chukchi Seas) and causing new ice formation in the openings left behind. The result is that the spring ice cover along the Siberian coast is thinner than usual and more likely to melt out in summer. The 2019 to 2020 winter AO was at a record or near record positive phase (Figure 5). According to our colleague Jamie Morrison at the University of Washington, this summer’s pronounced retreat of ice north of the Laptev-Kara-Barents-Seas region is consistent with the effects of the positive winter AO. Morison notes that the winter AO has been generally positive over the past 30 years, particularly so over the last 10 years. He speculates that the atmospheric circulation pattern associated with the AO may also favor a greater influence of Atlantic water heat on the sea ice cover through weakening the cold halocline layer—the cold, but low density water at the ocean surface.
Arctic sea ice age
Figure 6. The upper left map shows sea ice age distribution toward the end of the melt season for 1985 and the upper left map shows the end of the 2020 melt season. The bottom time series of different age categories shows the minimum extent for 1985 to 2020. Note that the ice age product does not include ice in the Canadian Archipelago. Data from Tschudi et al., EASE-Grid Sea Ice Age, Version 3
Credit: W. Meier, National Snow and Ice Data Center and M. Tschudi et al.
With the minimum reached, the remaining sea ice has had its “birthday,” aging one year. Assessing the ice age just before this birthday gives an indication of the health of the ice at the end of the melt season. The extent of the oldest ice (4+ years old) at that time in 2020 was 230,000 square kilometers (89,000 square miles). This is considerably higher compared to last year, when the 4+ year old ice extent stood at 55,000 square kilometers (21,000 square miles) at the 2019 minimum. The increase in 4+ year old ice in 2020 was compensated by a slight decrease in 2- to 3-year old ice and 3- to 4-year old ice (Figure 6). Overall, since the 1980s, when older ice covered over 2 million square miles (772,000 square miles) of the Arctic Ocean, sea ice has become much thinner and younger. The linear downward trend in 4+ year old ice extent at the sea ice minimum is 70,000 square kilometers (27,000 square miles) per year, equivalent to a decline of 6.1 percent per year relative to the 1984 to 2020 average.
Antarctica maximum may have been reached
Figure 7. Arctic sea ice extent for September 2020 was 18.77 million square kilometers (7.25 million square miles). The magenta line shows the 1981 to 2010 average extent for that month. Sea Ice Index data. About the data
Credit: National Snow and Ice Data Center
Antarctic sea ice extent may have reached its maximum of 18.95 million square kilometers (7.32 million square miles) on September 28, but the extent could still expand in the coming days. As is typical this time of year, there are wide swings caused by winds and storms along the extensive ice edge. Ice extent is now well above the 1981 to 2020 median extent. This follows a remarkable transition from generally below median extent beginning in August 2016 to well above median extent just in the seven weeks preceding October 1, 2020. Ice extent is above the median extent along a broad area off the Wilkes Land coast and western Ross Sea, near the median extent from the Amundsen Sea clockwise to the Weddell Sea and above the median north of Dronning Maud Land, Enderby Land, and the Cosmonaut Sea. The only major area of below the median extent is in the Indian Ocean sector near the Amery Ice Shelf and eastward.
References
Morison, J. 2020. Workshop on observing, modeling, and understanding the circulation of the Arctic Ocean and Sub-Arctic Seas. Retrieved here.


/https://public-media.si-cdn.com/filer/74/f8/74f86f78-ce74-47fb-8e3d-c96ac9494b16/3.jpg)


/https://public-media.si-cdn.com/filer/32/88/32883ad2-8ef1-494e-ab85-d006b549eef6/2.jpg)


