This year we do not have the wind system driving the pack ice out of the western Arctic as occured last season. We can assume that this is because we had a much more conventional winter and that there was no surplus heat to dispose of.
In any event, there is scant perennial ice left in the Arctic today. I expect that the extent and volume of perennial sea ice is likely to reach a stable minima over the next five years. What I mean by his is that a natural cycle of creation and destruction will dominate in which a finite amount of ice created close to the arctic islands will travel perhaps three years accumulating more ice each season until pushed into Arctic Gyre and been broken up.
It is apparent that the ice caught in the Gyre is losing more mass than it is gaining during the winter and will eventually reach a mass minima.
Much as I would love to see a month of clear sailing in the Arctic, it is certainty not necessary.
Today the areal extent is still large for lack of wind packing, but it is also very obvious that the coverage is likely around fifty percent and it will melt for another six weeks.
As I have emphasized in the past, we are going to have a net loss of ice mass again this year. There has been no reversal of this very clear trend. The problem for observers has been that the apparent areal extent of the annual winter ice has totally obscured our ability to measure the actual sea ice mass.
That is why we woke up one morning in 2000 and discovered that sixty percent had disappeared over the past forty years, which had been the last time we checked. I think that we are a little better at it now.
And as I have pointed out last year, we are in the final collapse phase of this primary melt. The winds last year gave it all a good kick, but it was already primed. This is a normal year, so once again the losses are still obscured.
We are still very much on track for a minima been established by 2012 as the collapse is continuing and shows no sign of been even slowed down.

Daily image update


Sea ice data updated daily, with one-day lag: extent (left), time series (right). Orange line in extent image and gray line in timeseries show normal extent for the day shown from 1979 to 2000. Click for high-resolution versions. To learn more about the data used, see About the data.
—Credit: National Snow and Ice Data Center
Arctic sea ice reflects sunlight, keeping the polar regions cool and moderating global climate. According to scientific measurements, Arctic sea ice has declined dramatically over at least the past thirty years, with the most extreme decline seen in the summer melt season.
Read timely scientific analysis year-round below. We provide an update during the first week of each month, or more frequently as conditions warrant.
Please credit the National Snow and Ice Data Center for image or content use unless otherwise noted beneath each image.
Have a question about sea ice? Visit our updated questions and answers page.
August 1, 2008
Race between waning sunlight and thin ice
Sign up for the Arctic Sea Ice News RSS feed for automatic notification of analysis updates.
The Arctic sea ice is now at the peak of the melt season. Although ice extent is below average, it seems less likely that extent will approach last year’s record low.
The pace of summer decline is slower than last year’s record-shattering rate, and peak sunlight has passed with the summer solstice. However, at least six weeks of melt are left in the season and much of the remaining ice is thin and vulnerable to rapid loss. A race has developed between the waning sunlight and the weakened ice.
Note: Analysis updates, unless otherwise noted, now show a single-day extent value for Figure 1, as opposed to the standard monthly average. While monthly average extent images are more accurate in understanding long-term changes, the daily images are helpful in monitoring sea ice conditions in near-real time.
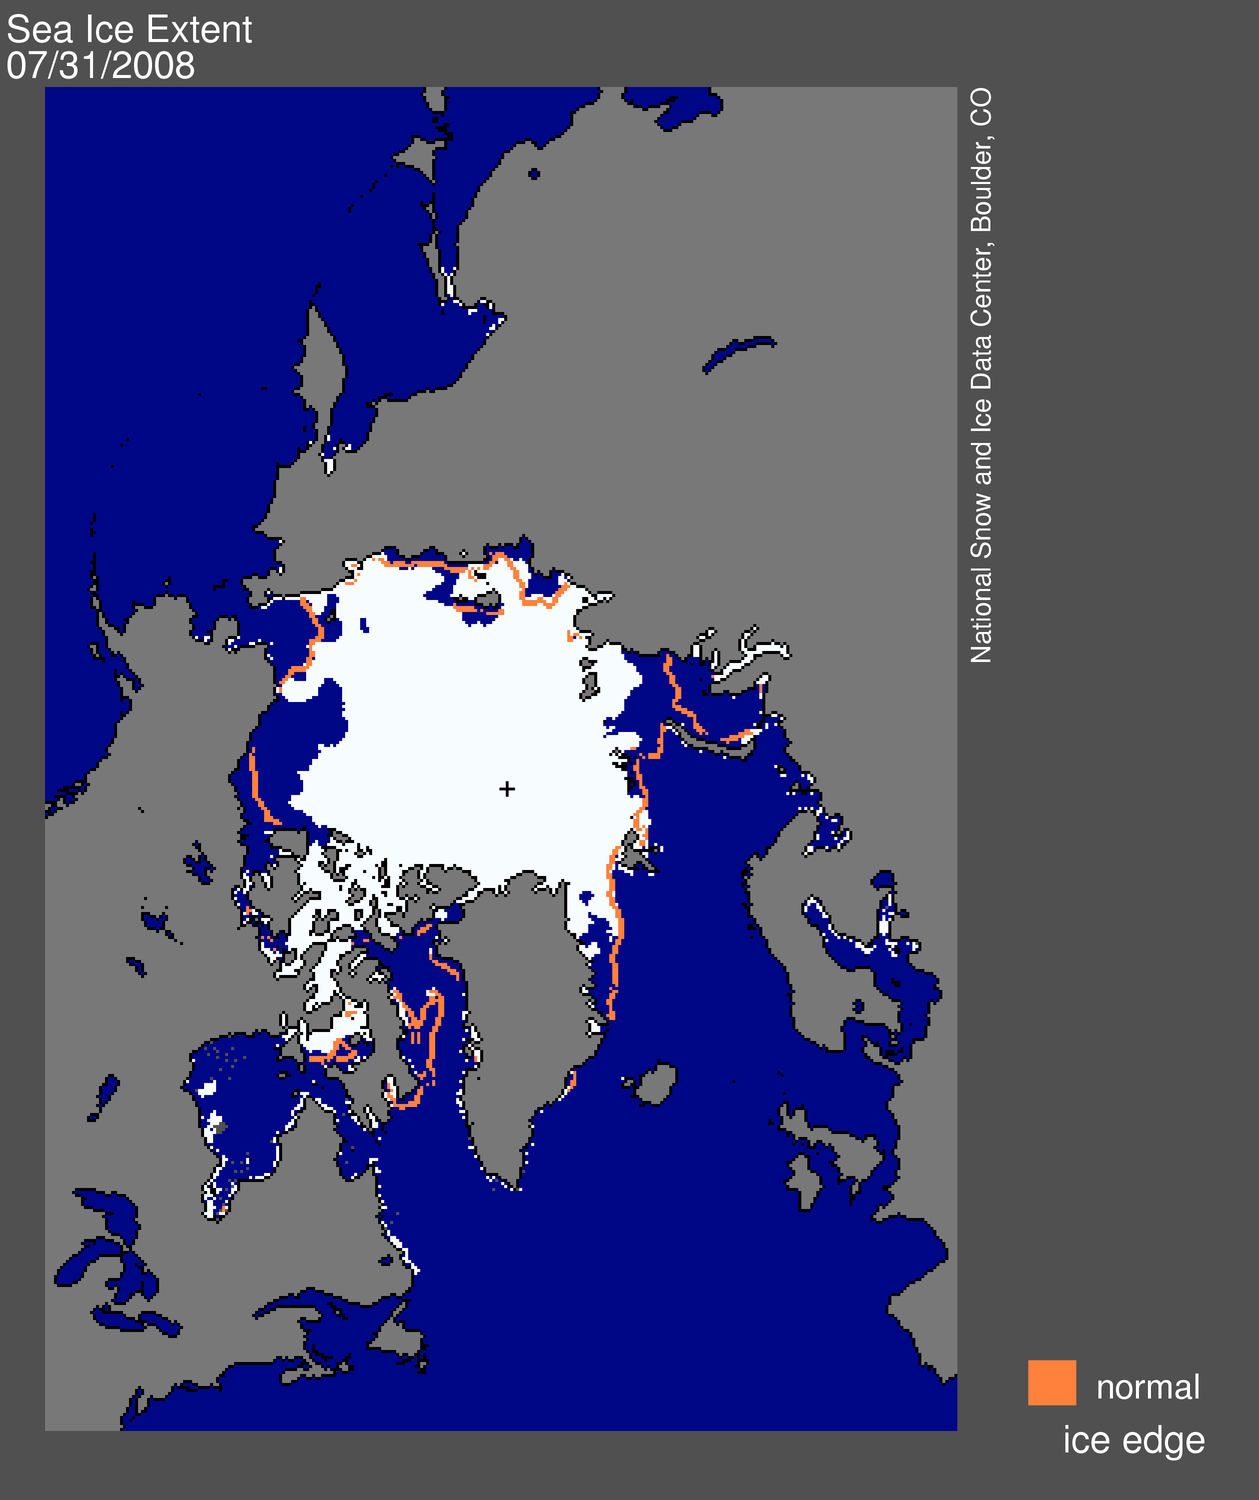
High-resolution image
Overview of conditions
Arctic sea ice extent on July 31 stood at 7.71 million square kilometers (3.98 million square miles). While extent was below the 1979 to 2000 average of 8.88 million square kilometers (3.43 million square miles), it was 0.89 million square kilometers (0.35 million square miles) above the value for July 31, 2007. As is normal for this time of year, melt is occurring throughout the Arctic, even at the North Pole.
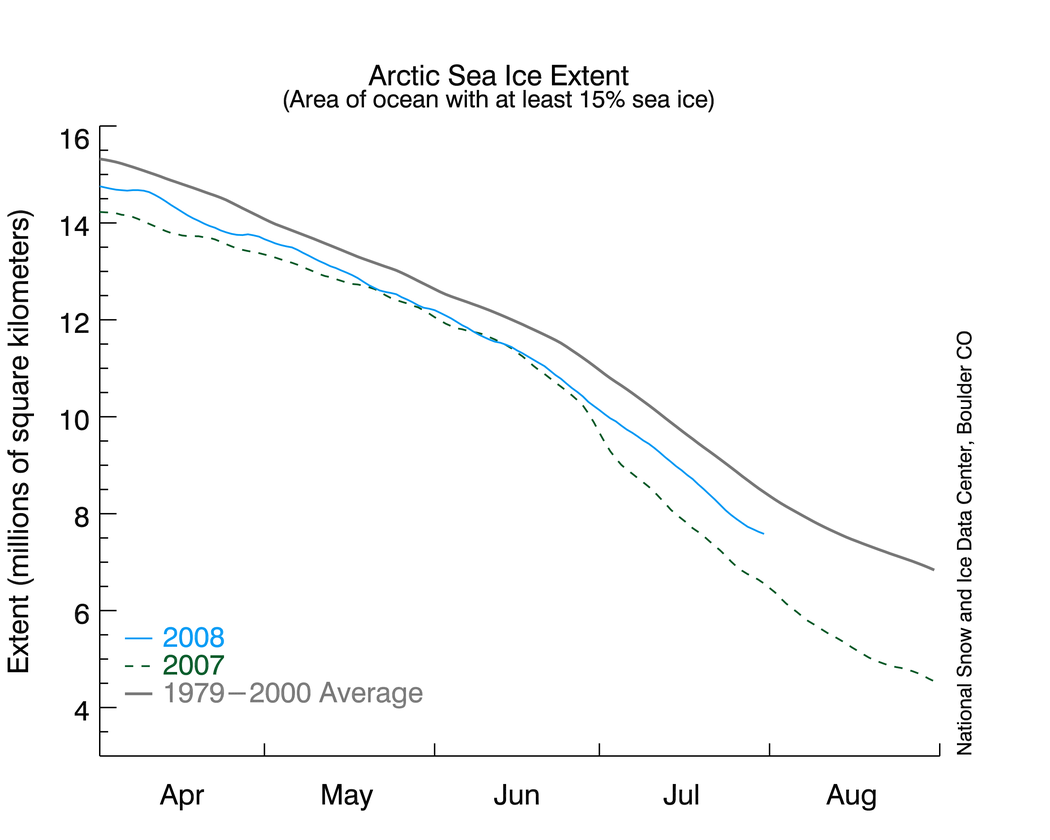
Figure 2. Daily sea ice extent; the blue line indicates 2008; the gray line indicates extent from 1979 to 2000; the dotted green line shows extent for 2007. Sea Ice Index data.
—Credit: National Snow and Ice Data Center
High-resolution Image
Conditions in context
Sea ice extent continues to decline, but we have not yet seen last July’s period of accelerated decline. Part of the explanation is that temperatures were cooler in the last two weeks of July, especially north of Alaska.
Because we are past the summer solstice, the amount of potential solar energy reaching the surface is waning. The rate of decline should soon start to slow, reducing the likelihood of breaking last year's record sea ice minimum.

—Credit: National Snow and Ice Data Center
High-resolution image
Slower decline than 2007
To estimate the range of possibilities, we have used average long-term daily decline rates to project ice extent during the rest of the season (dashed blue lines). The bottom dashed line shows decline rate one standard deviation faster than normal, the middle dashed line shows decline at average rates, and the top dashed line shows decline rate one standard deviation slower.
If the Arctic experiences a normal decline rate, the minimum extent will be between the second-lowest extent, which occurred in 2005, and the third-lowest extent, which occurred in 2002. Even at a rate one standard deviation faster than normal, the extent will not fall below last year’s minimum—so it appears unlikely that we will set a new record low.
But a more vulnerable ice cover
Nevertheless, it is perhaps too soon to make a definitive pronouncement concerning this year’s probable extent at the summer minimum. The Arctic sea ice is in a condition we have not seen since satellites began taking measurements. As discussed in our April analysis, thin first-year ice dominated the Arctic early in the melt season. Thin ice is much more vulnerable to melting completely during the summer; it seems likely that we will see a faster-than-normal rate of decline through the rest of the summer.
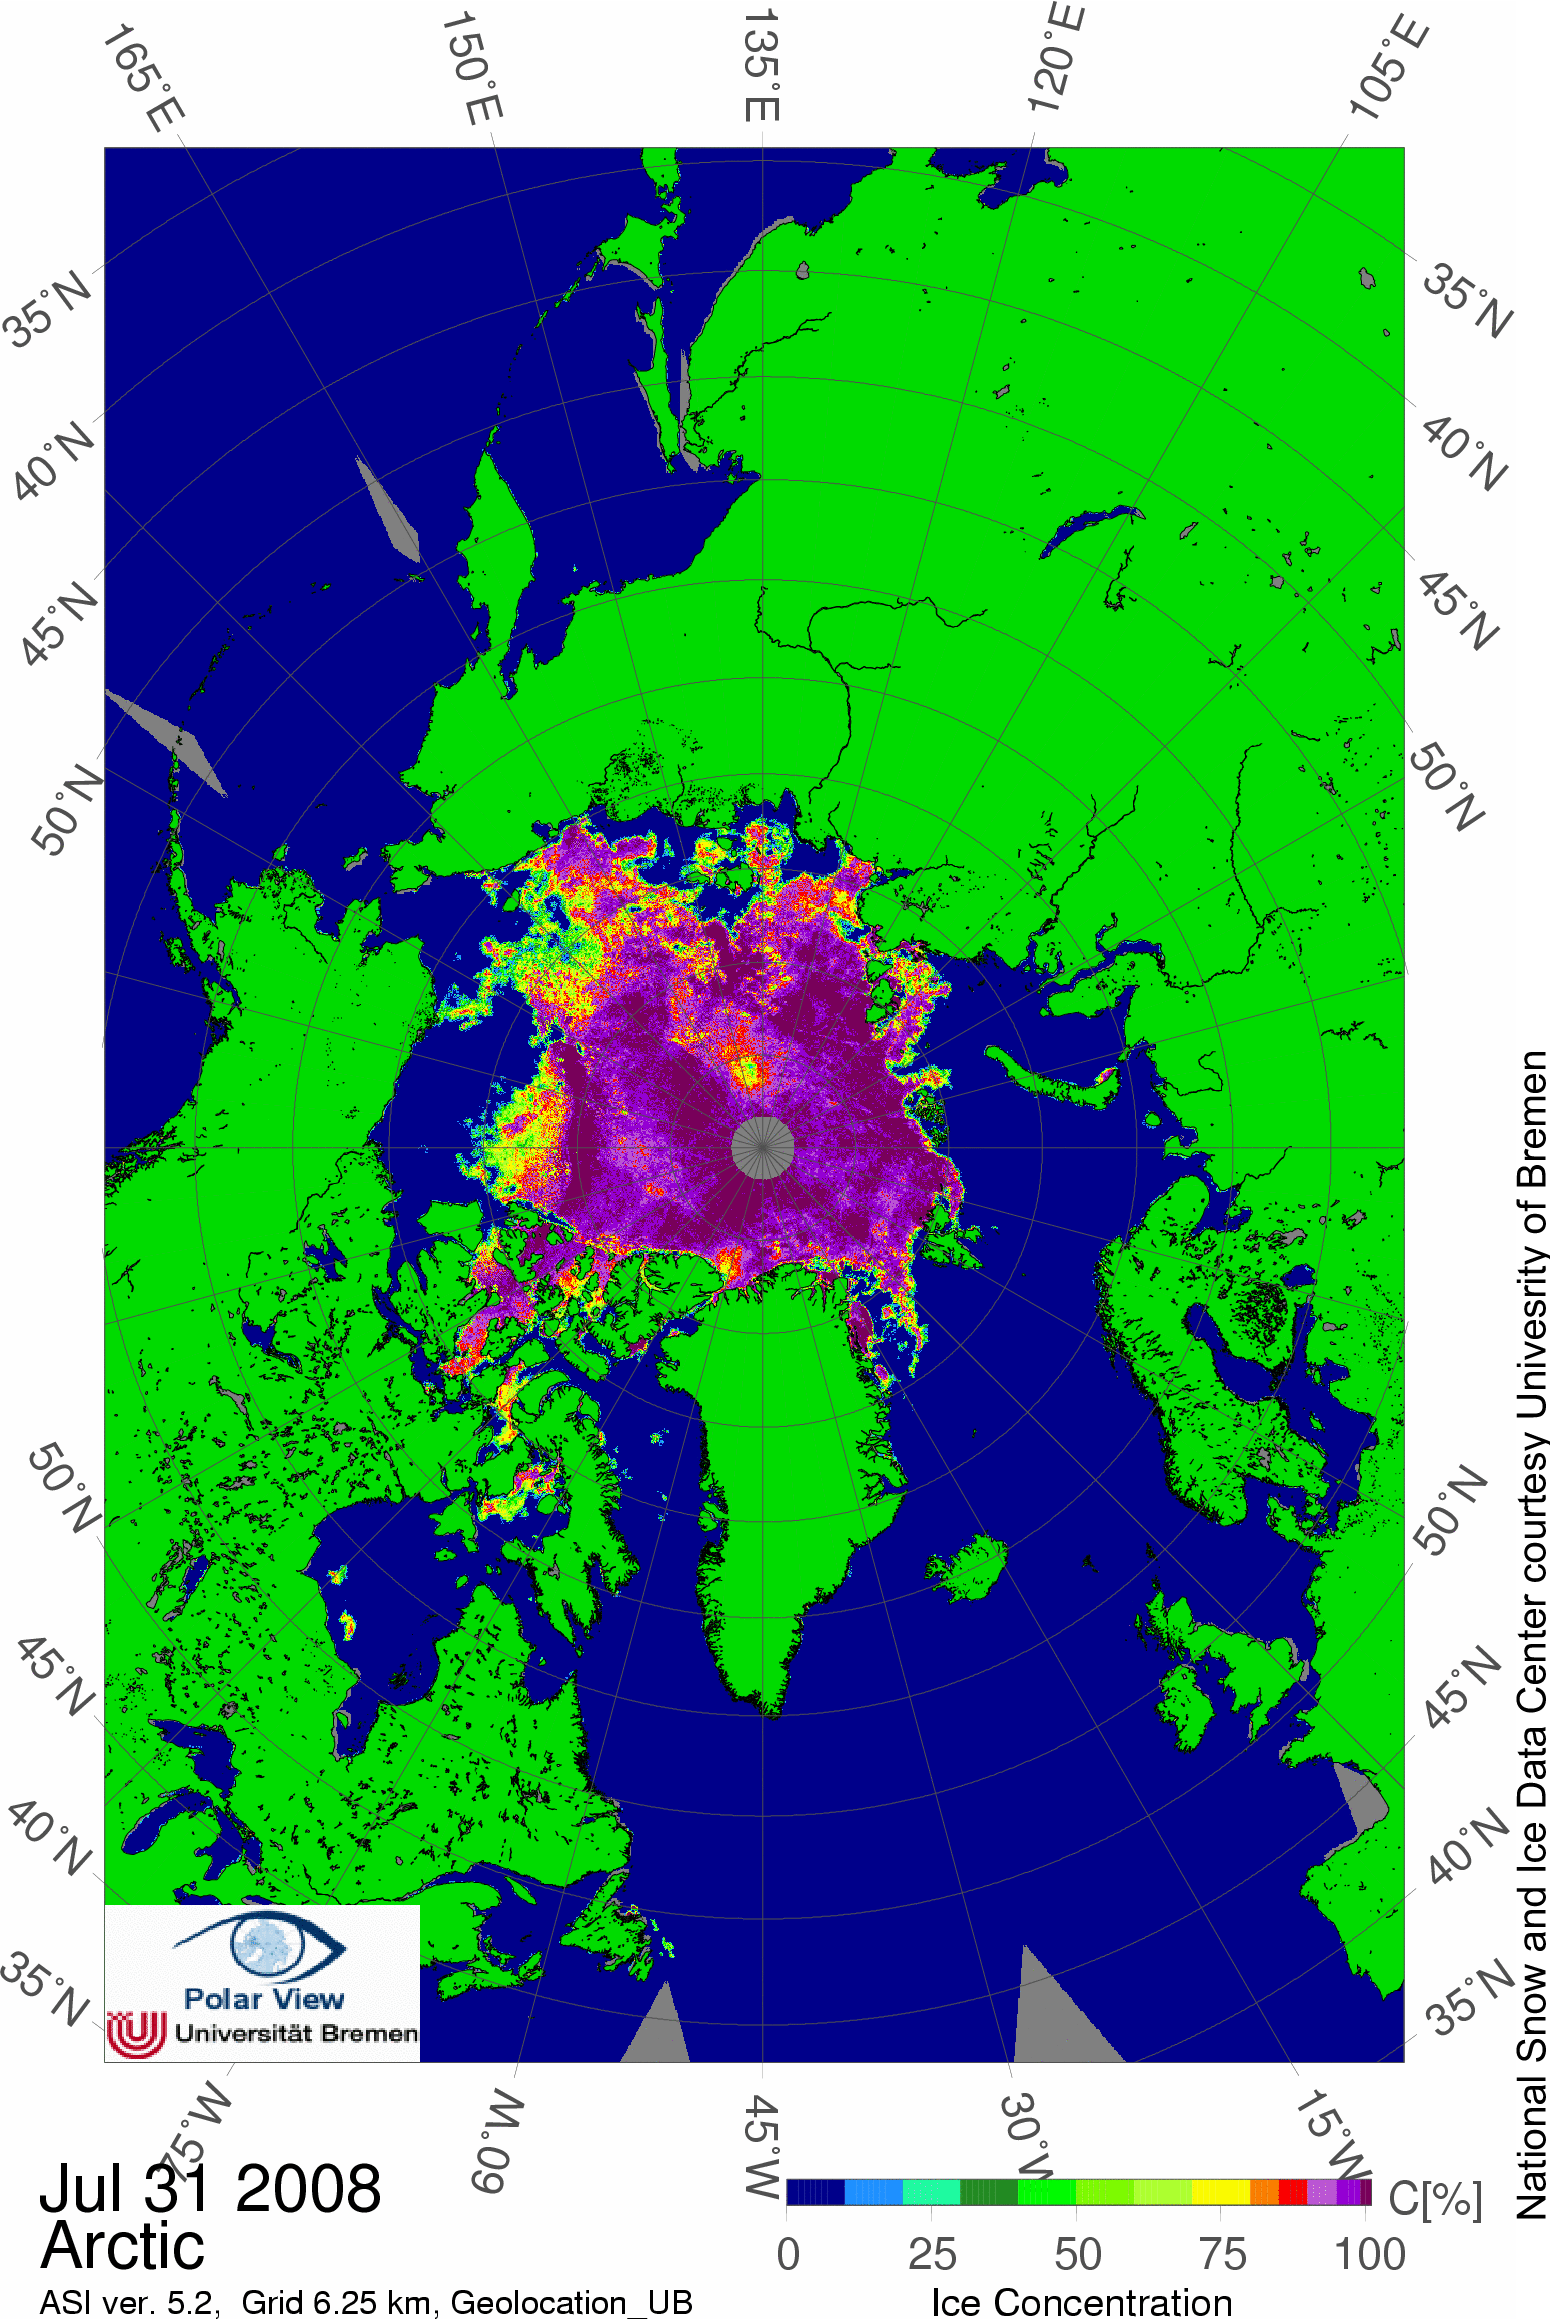
Building on our July 17 analysis, the fragility of the current ice conditions is evident in the sea ice concentration fields produced at the University of Bremen using NASA Advanced Microwave Sounding Radiometer (AMSR) data. Widespread areas of reduced ice concentration exist, particularly in the Beaufort Sea. Even north of 85 degrees latitude, pockets of much-reduced ice cover appear. The passive microwave data used in Figure 4 tends to underestimate ice concentration during summer because melt water on the surface of the ice can be mistaken for open water. Nevertheless, such low concentrations indicate strong melt and a broken, thin ice cover that is potentially vulnerable to rapid melt.
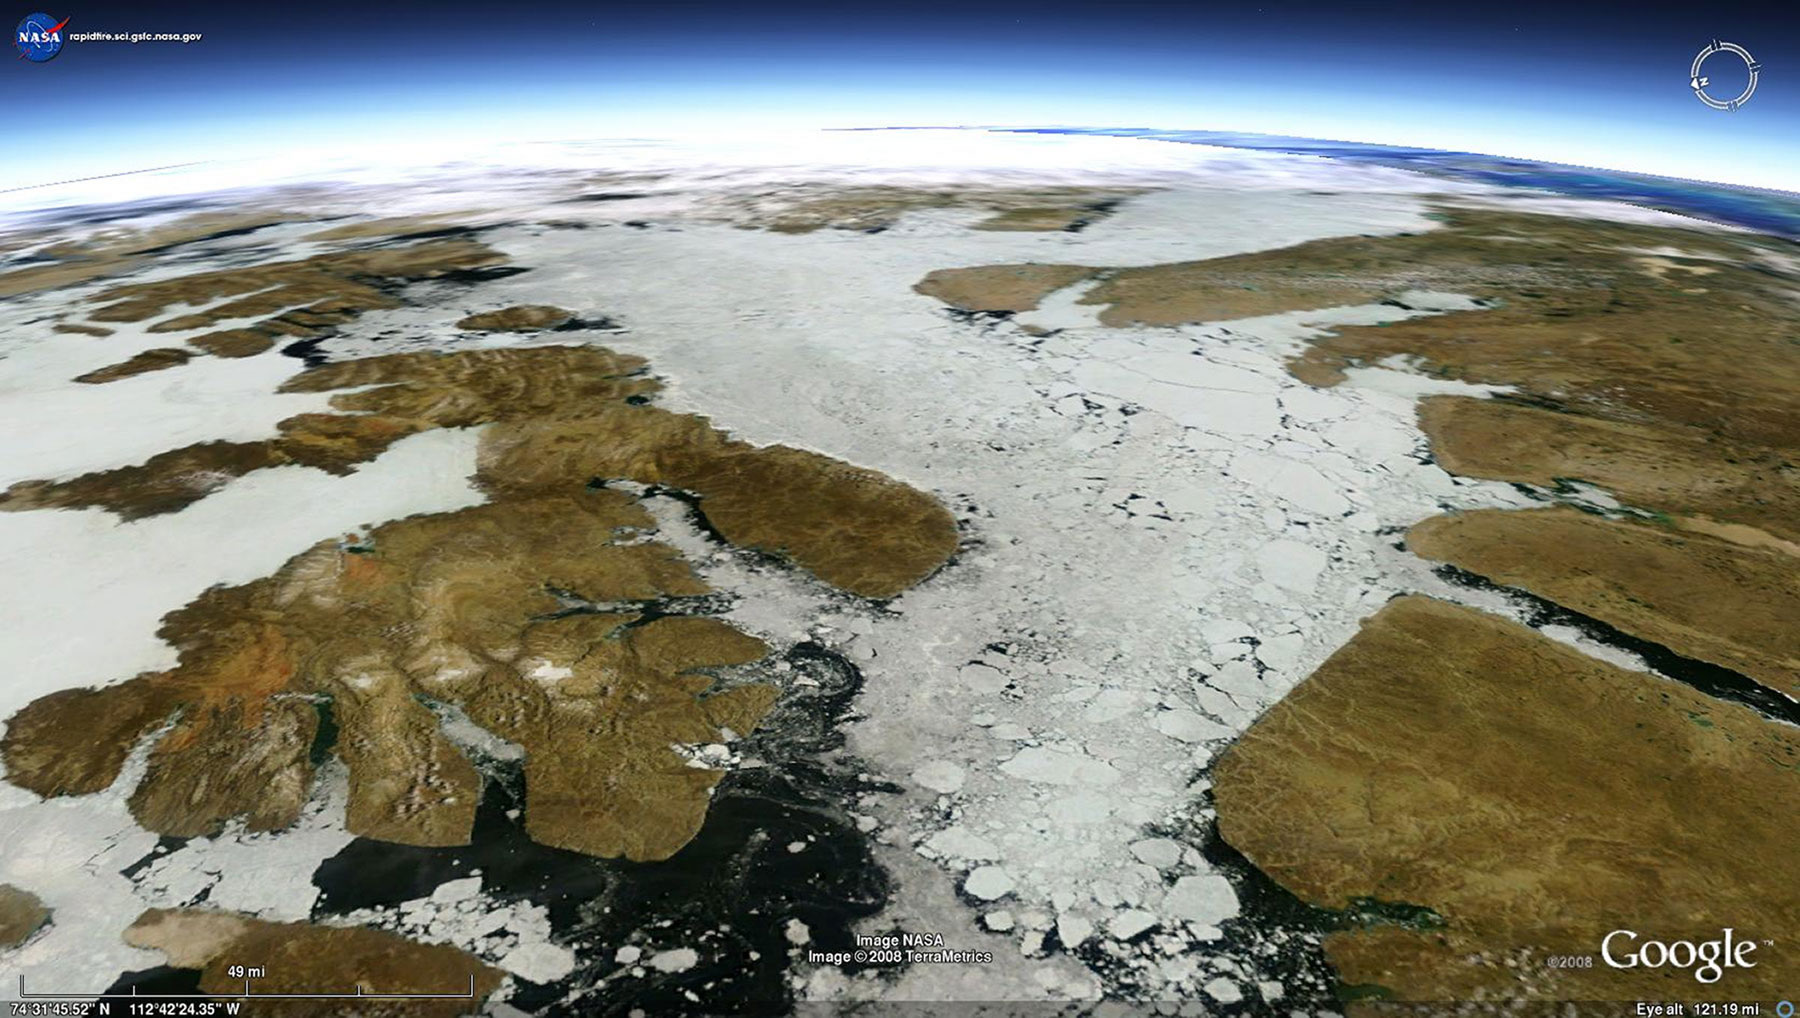
Figure 5.Visible-band satellite imagery confirms the low-concentration ice cover seen in Figure 4. This view places NASA MODIS Aqua data in a perspective generated in Google Earth, simulating a view from far above Earth.
No comments:
Post a Comment