Unbelievably, the map we appear to have is produced by indirect means from mapping the oceans surface. This takes the problem of resolution to a whole new level.
what we need is robotic subsea drones able to operate just off hte bottom. We can actually build these and communicate as well. Then it becomes a case of observation span and running millions of traverses. Of course we have hardly done this on land unless it is been cultivated.
I really want it done though because we have around 10,000 years of potential ship wrecks to lovcate down there. Nothing usually happens in the Deep over thousands of years.
Why Is It So Difficult to Map the Ocean?
The most complete maps we have of the ocean floor lag far behind the maps we have of the moon.
BY LAURA TRETHEWEY
November 10, 2023
https://nautil.us/why-is-it-so-difficult-to-map-the-ocean-436109/
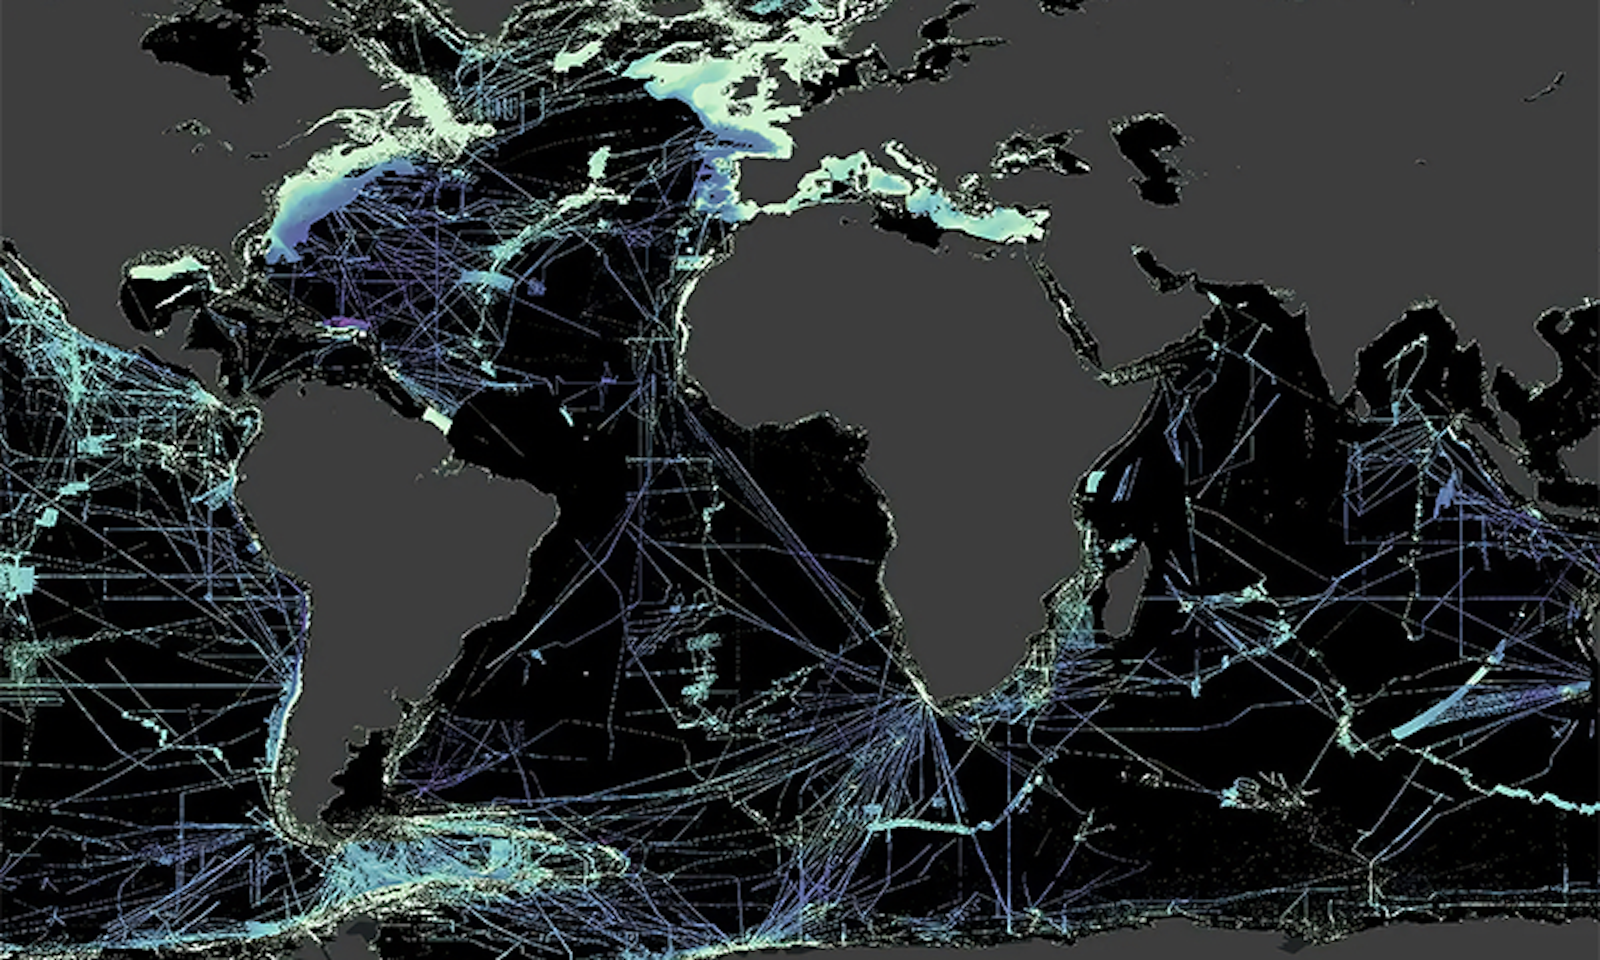
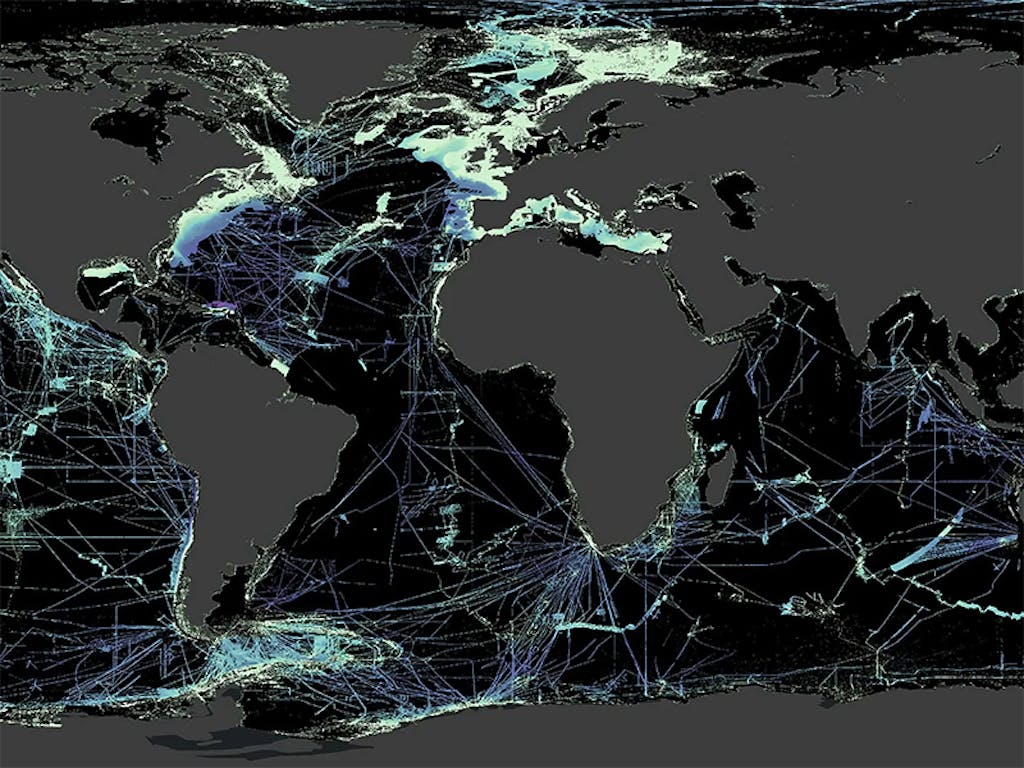
Cassie Bongiovanni’s favorite way to show people just how little we know about the seafloor is to open the mapping software on her computer and strip the world map down to what we do know about the seafloor. “You can see why this whole mapping thing is important,” she said with a laugh as she showed me the process one day over Zoom. “Because there’s nothing here! This is why. This is the big picture. There is no big picture!” The effect was startling. In an instant, the map went from a rich three-dimensional tapestry of underwater mountains, trenches, and canyons to flat, white nothing. That was especially true in deep waters outside national jurisdiction.
In Bongiovanni’s experience, people are often surprised to learn that we haven’t mapped the ocean already. It’s the 21st century, and humanity has done far more impressive things, including landing a robot on Mars and editing human genes. World maps tend to foster the impression that the planet is already charted. When I was a child, I remember running my finger over a spinning globe and feeling the raised bumps that stood in for the Rocky Mountains in North America, the Himalayas in Asia. The ocean, however, was a smooth, blank blue. Back then, it didn’t seem odd that the rough contours of land stopped at the water’s edge. Perhaps I assumed that the smooth surface indicated water? More likely, I didn’t think about it all. But it seems obvious now that the dramatic terrain on land must continue beneath the sea.
Mount Everest could fit into the Mariana Trench with a mile to spare.
It’s not easy for Bongiovanni whenever a stranger asks her what she does for a living. She says, “I have to explain it to people: ‘The ocean is not mapped.’ ” That is a genuinely confusing statement, because a quick glance at Google Maps seems to contradict it: The ocean appears to be mapped. Except ocean
The study of the ocean surface is a “reliable kind of phrenology,” writes the science journalist Robert Kunzig, because its dips and bumps hint at what lies on the seafloor. With enough measurements, the satellites can pinpoint a permanent dip or bump in the ocean surface, which means that a canyon or seamount is somewhere in the vicinity. Water naturally piles up on top of seamounts and sinks down into canyons, and the sheer mass of all that water changes the gravity. “People are absolutely mind-blown when you tell them the surface of the ocean is not the same everywhere,” said Bongiovanni.
If the globe I had as a child had shown the true shape of the planet, it would be one lumpy ball indeed. The first thing that would catch your eye would be the midocean ridge system, an underwater mountain range that runs 40,000 miles around the planet. It is the world’s largest geographic feature, but it is mostly invisible to us, covered by a dense cloak of ocean 2.5 miles deep. In just a few places, the midocean ridge rears up on land, as in Iceland, where it has ripped open valleys and thrust tempestuous volcanoes up toward the sky. The true summits of the sea are not the midocean ridges, but the deep ocean trenches that Victor Vescovo intended to dive: the Mariana Trench in the Pacific Ocean, the Puerto Rico Trench in the Atlantic Ocean, the Java Trench in the Indian Ocean, the Molloy Hole in the Arctic Ocean, and the South Sandwich Trench in the Southern Ocean.

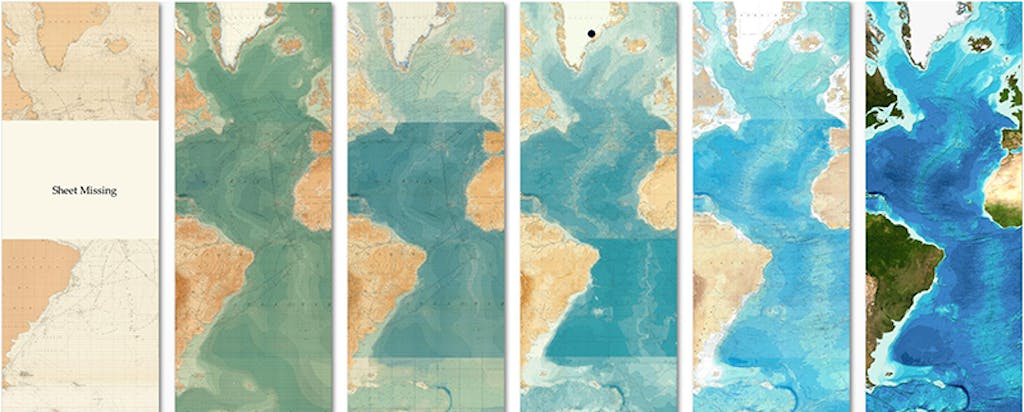
BETTER WITH TIME: The Mid-Atlantic Ridge as it has appeared in the General Bathymetric Chart of the Oceans since 1903. Courtesy of Frontiers in Marine Science / Anthony Pharaoh, IHO.
The deepest of the trenches, the Mariana, is just shy of 7 miles deep, dwarfing the tallest mountains on land. Mount Everest, for instance, could fit into the Mariana Trench with a mile to spare. The prairies of the abyss are covered in soft sediment as fine and billowy as dust. The abyssal plains make up more than half the Earth’s surface and far outstrip all the grasslands of the Eurasian Steppe between Hungary and China. These muddy plains hold what is known poetically as marine snow but is actually the remnants of trillions of dead plankton drifting down over billions of years. There’s also eroded rock washing off land, like the never-ending deluge of sediment from the Himalayas streaming into the Indus and Ganges Rivers and out into the Indian Ocean. Two extraordinary fans of sediment sweep off both coasts of India, thousands of miles long and 12 miles deep in some places. The seafloor is also more seismically active than land, with exploding underwater volcanoes, sizzling hot springs, fracturing and rifting tectonic plates, and shuddering earthquakes. The grandest waterfall in the world is not Venezuela’s Angel Falls, at 3,212 feet tall; it’s on the seafloor between Greenland and Iceland, where cold, dense water from the Nordic Seas collides with the lighter, warmer water of the Irminger Sea and plunges over a hidden cataract 11,500 feet down to the seafloor. Everything about the seafloor is bigger, bolder, and more extreme than the comparatively quiet terrain we know as land.
David Sandwell, a geophysicist at the Scripps Institution of Oceanography in La Jolla, California, is one of the pioneers in mapping the seafloor with satellites. You might expect him to boast about his achievements a little, but he is characteristically blunt about the limitations of his work. “I can tell you what the problem is with the satellite [maps] and that we’ll never fix it,” he said. “The mean ocean depth is about 4 kilometers [2.5 miles], and what we’re measuring in the satellite is the variations in the pull of gravity. That’s the sea surface topography. When you have gravity on the seafloor, it pretty much mimics the actual topography, but as soon as you take [the gravity] from the level of the seafloor up that 4 kilometers, it gets blurred by physics.” This is called upward continuation, and the length of the blurring is equal to the depth of the seafloor. “We’re never going to get better resolution than 4 kilometers, which is pretty terrible,” said Sandwell. “We’ll never fix it. It’s physically impossible.”
There is literally no other space on Earth as big as the global seafloor.
Over the last 20 years, Sandwell and his collaborator Walter Smith at the National Oceanic and Atmospheric Administration (NOAA) have worked to improve the maps. In 2014, they released a new one that charted the entire global seafloor to a resolution of 6 kilometers (3.75 miles). That was a vast improvement on their earlier map, released in 1997, which detailed the seafloor with a resolution of 12 kilometers (7.5 miles). These are still the best, most complete maps we have of the ocean floor, but they lag far behind the maps we have of the moon, Mars, and Venus. Entire seamounts disappear inside a resolution of 5 kilometers (3 miles), and the true size and location of features in the satellite-predicted maps can be “hugely off, massively off,” according to Bongiovanni. She has discovered seamounts miles away from where the satellites predicted. The best way to map the seafloor is to send out a survey ship and sound the seafloor piece by piece by piece.
Sitting there with her, staring at all the uncharted terrain, I realized that it is not a map. Or at least, it’s not what we expect of the maps we see on our phones, with the pinpoint precision of the little blue dot indicating our position. Instead, the best maps we have of the seafloor show us how little we know about the planet. There is so much more down there to explore: blown-out, flattened volcanoes known as guyots, mud volcanoes spewing methane, underwater lakes known as brine pools that are so salty they are lethal to almost every life-form except a few microorganisms that might be analogues to the aliens we seek on distant planets.
In my interviewswith Cassie Bongiovanni, my mind kept snagging on a few key concepts in ocean mapping. Like, how much seafloor is left to map? And why is it so difficult to measure the deepest depth of the ocean?
A quick search online tells me that the surface area of the global ocean covers 139.7 million square miles (362 million square kilometers), or 71 percent of the planet’s surface. But what does 139.7 million square miles feel and look like in human terms? There is literally no other space on Earth as big as the global seafloor. That means there is no terrestrial comparison to draw on, such as the height of the Eiffel Tower or the length of Manhattan. Perhaps that’s why we stretch for the stars and compare the seafloor to outer space. Perhaps it’s why we say things such as “We know more about the surface of the moon than we do the bottom of the planet.”

THE GREAT UNKNOWN: Bright lines denote areas of the ocean that have been rigorously mapped; dark areas have yet to be. Credit: Vicki Cerrini / Seabed 2030.
Alan Jamieson absolutely loathes that sentence. One of the main reasons for his vitriol is that it’s not that impressive to say we know more about a small, dry, lifeless moon than we do about our own big, watery, lively planet. The moon is tiny compared to Earth, at about 7.5 percent its size. The North Atlantic alone accounts for more surface area than the entire moon. Even the width of Australia is girthier than the moon’s rather slim waistline. In 2019, Seabed 2030 announced that its newest map of the world’s seafloor, known as the “global grid,” now covered 15 percent of the ocean at the desired resolution. That means we’ve already mapped nearly one-and-a-half moons’ worth of seafloor. “That’s pretty good, like why are we hitting ourselves over this?” Jamieson ranted on The Deep-Sea Podcast. A journalist even quoted Jamieson as saying the statement in an article. Jamieson, of course, emailed the journalist to clarify that he had never, would never say such a thing and remembered the journalist’s response as being “Well, that’s what people say. We’re going to put it in. This is what people want to hear.” The sentence irked him so much that he published an entire paper tracking it down to an academic paper written in the 1950s, when humanity had visited neither the moon nor the deep sea.
No comments:
Post a Comment